
*Due to the platform's features, the charts are arranged in sequence from left to right, from the first to the ninth chart. The charts were created by our team and based on an analysis from Bloomberg and the EIA data. This analysis was conducted in cooperation with Anastasia Volkova, analyst of LSE.
Natural gas enters Week 49 with a notable shift, as January 2026 futures breach the $5/MMBtu mark-28-32% above year-ago levels-driven by a historic cold snap and peak LNG exports. The entire 2026 curve now sits well above the 15-year upper quartile, with a rare inversion (2026 > 2027) of 40-70 cents signaling intense near-term demand. Storage is set to fall -13 BCF for Week 48 (November 28), beating the 5-year average draw of -31 BCF, leaving inventories at 3,922 BCF-still 208 BCF above the median but 29 BCF below 2024. HDD+CDD values hit 30-year highs, with further spikes forecast until December 5-6 before normalizing.
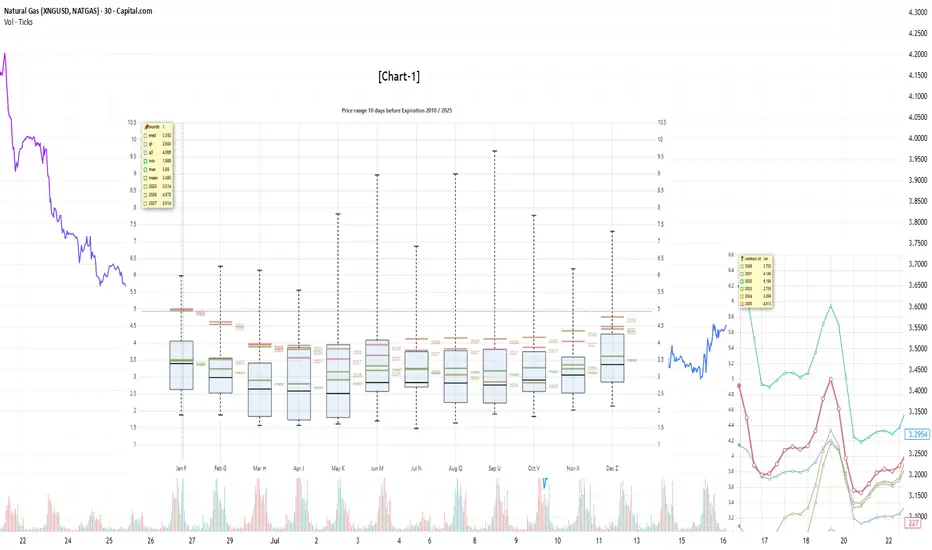
Current prices compared to price dispersion 10 days before expiration by month since 2010
[Chart-1]
Cold weather in the US and record LNG flows continue to provide strong support for natural gas prices. January 2026 futures are already trading confidently around the psychological mark of USD 5.00/MMBtu, which is approximately 28-32% higher than the same contract a year earlier. The entire 2026 futures curve is now significantly above the upper limit of the interquartile range for the last 15 years and, notably, significantly exceeds the 2027 quotes (the gap reaches 40-70 cents for most months). Possible reasons for this curve inversion (2026 > 2027) include a combination of factors: expectations of very cold weather, maximum utilization of export terminals, plans to commission large volumes of new LNG capacity, and high demand from the energy sector for new data centers.
Forward curve compared to 2020-2025
[Chart-2]
The shape of the 2025 forward curve on nearby contracts has broken away from the 2023-2024 ranges, but contracts with delivery in two years and beyond continue to show clear price stabilization at historically stable levels.
Current stocks and forecast for next week compared to 2019-2024
[Chart-3]
According to the forecast for week 48 (November 28), gas reserves in underground storage facilities will decrease by -13 BCF, which is higher than the average of -31 BCF over the past five years. At the same time, the stock level will reach 3922 BCF, which is 29 BCF lower than the 2024 level, but 208 BCF higher than the 5-year average.
HDD+CDD based on current NOAA data and forecast for the next two weeks compared to 1994-2024
[Chart-4]
Currently, the total HDD + CDD (heating and cooling degree days) indicators for all climatic regions of the United States are at their highest level in decades relative to the 30-year climate norm. According to meteorological model forecasts, the increase in degree days will continue until December 5-6, after which a decline will begin, and by December 10-12, values will return to normal seasonal norms.
HDD+CDD based on current NOAA data and forecast compared to 1994-2024 by region
[Chart-5]
As of December 3, in terms of regions, the peak number of degree days is expected in the coming week, exceeding the upper interquartile range in the central regions of EN, ES, WN, WS, and South Atlantic. After December 10, the weather is expected to stabilize and return to average levels and below.
Daily supply/demand difference compared to 2014-2024
[Chart-6]
As of December 3, the difference between supply and demand in 2025 is above the maximum level for 2014-2024. The main drivers of demand growth over supply are increased consumption for industry, power generation, and household consumption due to cold weather. LNG exports are at peak levels.
Number of days for delivery from warehouses
[Chart-7]
The graph shows the number of days of supply from storage alone, based on current consumption levels. As of December 3, reserves are sufficient for ≈27 days, which is 1 day less than in 2024, 7 days below the average, and at the lower end of the 10-year minimum range. With this level of reserves and consumption, even minor disruptions in production or spikes in demand could cause sharp price reactions, especially in late winter and early spring.
Filling level of European storage facilities
[Chart-8]
The overall level of gas storage in Europe on December 3 fell by 2.7% over the week and stands at 74.9%, which is 10.5% below the average level and 10% lower than last year.
Electricity generation by source
[Chart-9]
Compared to last week, gas generation in the US48 energy balance on December 3, 2025, increased significantly to 43.9% of the total (+3% for the week). The share of nuclear generation decreased by 2% to 18% and is below the 5-year low. The share of coal generation increased by 1.5% to 19.7% and is at an average level. Wind (7.8%) and solar (3.2%) decreased slightly compared to last week.
Natural gas enters Week 49 with a notable shift, as January 2026 futures breach the $5/MMBtu mark-28-32% above year-ago levels-driven by a historic cold snap and peak LNG exports. The entire 2026 curve now sits well above the 15-year upper quartile, with a rare inversion (2026 > 2027) of 40-70 cents signaling intense near-term demand. Storage is set to fall -13 BCF for Week 48 (November 28), beating the 5-year average draw of -31 BCF, leaving inventories at 3,922 BCF-still 208 BCF above the median but 29 BCF below 2024. HDD+CDD values hit 30-year highs, with further spikes forecast until December 5-6 before normalizing.
Current prices compared to price dispersion 10 days before expiration by month since 2010
[Chart-1]
Cold weather in the US and record LNG flows continue to provide strong support for natural gas prices. January 2026 futures are already trading confidently around the psychological mark of USD 5.00/MMBtu, which is approximately 28-32% higher than the same contract a year earlier. The entire 2026 futures curve is now significantly above the upper limit of the interquartile range for the last 15 years and, notably, significantly exceeds the 2027 quotes (the gap reaches 40-70 cents for most months). Possible reasons for this curve inversion (2026 > 2027) include a combination of factors: expectations of very cold weather, maximum utilization of export terminals, plans to commission large volumes of new LNG capacity, and high demand from the energy sector for new data centers.
Forward curve compared to 2020-2025
[Chart-2]
The shape of the 2025 forward curve on nearby contracts has broken away from the 2023-2024 ranges, but contracts with delivery in two years and beyond continue to show clear price stabilization at historically stable levels.
Current stocks and forecast for next week compared to 2019-2024
[Chart-3]
According to the forecast for week 48 (November 28), gas reserves in underground storage facilities will decrease by -13 BCF, which is higher than the average of -31 BCF over the past five years. At the same time, the stock level will reach 3922 BCF, which is 29 BCF lower than the 2024 level, but 208 BCF higher than the 5-year average.
HDD+CDD based on current NOAA data and forecast for the next two weeks compared to 1994-2024
[Chart-4]
Currently, the total HDD + CDD (heating and cooling degree days) indicators for all climatic regions of the United States are at their highest level in decades relative to the 30-year climate norm. According to meteorological model forecasts, the increase in degree days will continue until December 5-6, after which a decline will begin, and by December 10-12, values will return to normal seasonal norms.
HDD+CDD based on current NOAA data and forecast compared to 1994-2024 by region
[Chart-5]
As of December 3, in terms of regions, the peak number of degree days is expected in the coming week, exceeding the upper interquartile range in the central regions of EN, ES, WN, WS, and South Atlantic. After December 10, the weather is expected to stabilize and return to average levels and below.
Daily supply/demand difference compared to 2014-2024
[Chart-6]
As of December 3, the difference between supply and demand in 2025 is above the maximum level for 2014-2024. The main drivers of demand growth over supply are increased consumption for industry, power generation, and household consumption due to cold weather. LNG exports are at peak levels.
Number of days for delivery from warehouses
[Chart-7]
The graph shows the number of days of supply from storage alone, based on current consumption levels. As of December 3, reserves are sufficient for ≈27 days, which is 1 day less than in 2024, 7 days below the average, and at the lower end of the 10-year minimum range. With this level of reserves and consumption, even minor disruptions in production or spikes in demand could cause sharp price reactions, especially in late winter and early spring.
Filling level of European storage facilities
[Chart-8]
The overall level of gas storage in Europe on December 3 fell by 2.7% over the week and stands at 74.9%, which is 10.5% below the average level and 10% lower than last year.
Electricity generation by source
[Chart-9]
Compared to last week, gas generation in the US48 energy balance on December 3, 2025, increased significantly to 43.9% of the total (+3% for the week). The share of nuclear generation decreased by 2% to 18% and is below the 5-year low. The share of coal generation increased by 1.5% to 19.7% and is at an average level. Wind (7.8%) and solar (3.2%) decreased slightly compared to last week.

Disclaimer
The information and publications are not meant to be, and do not constitute, financial, investment, trading, or other types of advice or recommendations supplied or endorsed by TradingView. Read more in the Terms of Use.
Disclaimer
The information and publications are not meant to be, and do not constitute, financial, investment, trading, or other types of advice or recommendations supplied or endorsed by TradingView. Read more in the Terms of Use.