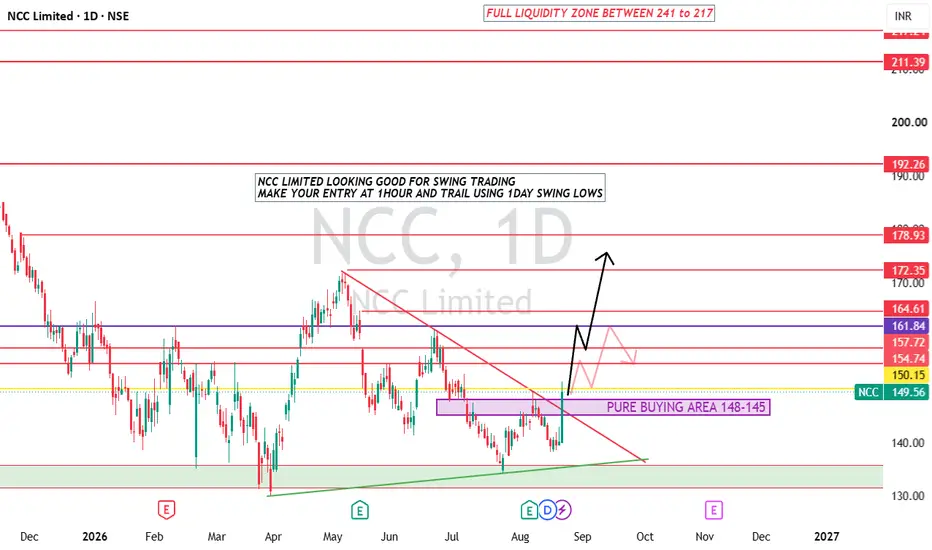
 NCC has broken out of a descending wedge continuation pattern on the daily chart. After forming a clear higher-low structure off the major ascending trendline, the stock confirmed strong demand with a +6.78% single-day impulse move. The price is expanding cleanly from the ₹145 – ₹148 demand zone.
Technical Parameters
Current Market Price: ₹149.56 (+6.78%)
Primary Accumulation Zone: ₹145.00 – ₹148.00 (Demand Floor / Value Area)
Immediate Support / Invalidated Below: ₹140.00 (Daily Swing Low)
Overhead Resistance Targets:
Target 1: ₹154.74 – ₹157.72 (First Pullback Level)
Target 2: ₹161.84 – ₹164.61 (Breakout Expansion Point)
Target 3: ₹172.35 – ₹178.93 (Intermediate Swing Highs)
Major Target: ₹192.26 – ₹211.39 (Upper Liquidity Zone)
Execution Plan
Entry Strategy: Look for execution on lower timeframes (1-Hour chart) on mild intraday pullbacks into the ₹145 – ₹148 zone.
Risk & Trailing: Trail risk progressively using 1-Day swing lows as the stock trends higher.
Trade active

Disclaimer
The information and publications are not meant to be, and do not constitute, financial, investment, trading, or other types of advice or recommendations supplied or endorsed by TradingView. Read more in the Terms of Use.
Disclaimer
The information and publications are not meant to be, and do not constitute, financial, investment, trading, or other types of advice or recommendations supplied or endorsed by TradingView. Read more in the Terms of Use.