
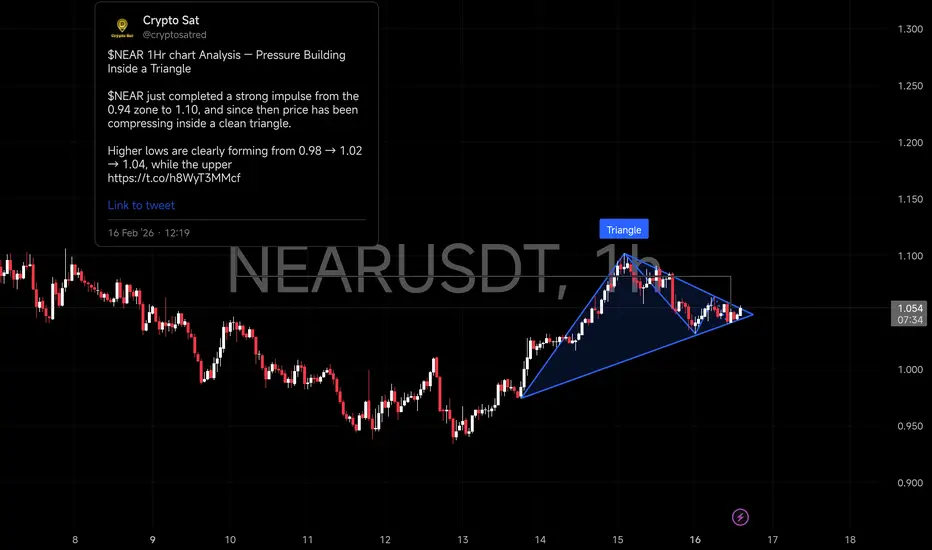
 NEAR 1Hr chart Analysis — Pressure Building Inside a TriangleNEAR just completed a strong impulse from the 0.94 zone to 1.10, and since then price has been compressing inside a clean triangle.
Higher lows are clearly forming from 0.98 → 1.02 → 1.04, while the upper trendline keeps rejecting near 1.08–1.10. That means liquidity is stacking on both sides.
Current price around 1.05 is right near the apex — and when triangles reach this stage, expansion usually follows quickly.
If buyers reclaim 1.08–1.10, expansion toward 1.15–1.18 becomes realistic.
If support near 1.04–1.02 gives way, expect a quick flush toward 0.99–1.00 liquidity.
Right now, this is a reaction zone — not a prediction zone.

Disclaimer
The information and publications are not meant to be, and do not constitute, financial, investment, trading, or other types of advice or recommendations supplied or endorsed by TradingView. Read more in the Terms of Use.
Disclaimer
The information and publications are not meant to be, and do not constitute, financial, investment, trading, or other types of advice or recommendations supplied or endorsed by TradingView. Read more in the Terms of Use.