
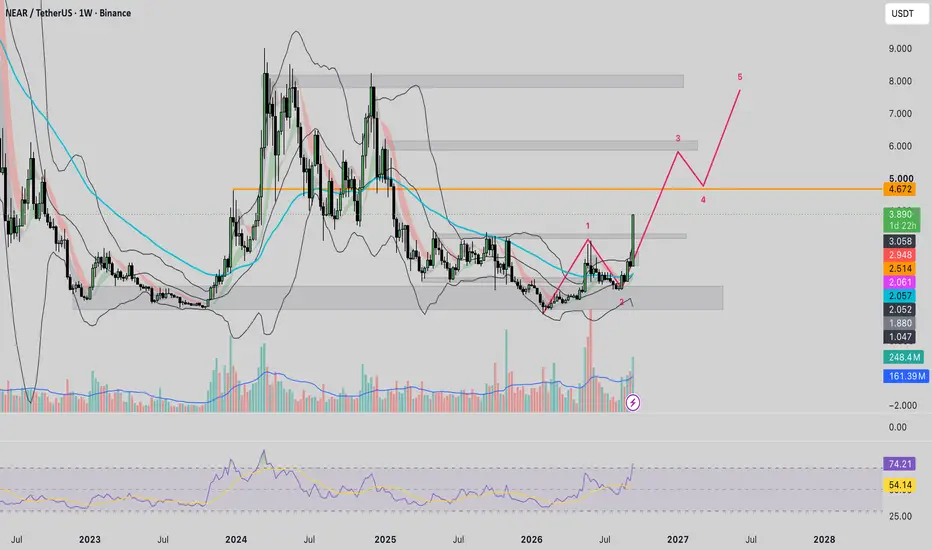
NEAR/USDT Elliott Wave Trading Plan (1W Timeframe)1. Market Context & Wave Count AnalysisTimeframe: Weekly (1W) Current Trend: Transitioning from a corrective/consolidation phase into an impulsive bullish cycle. Wave Structure:Wave 1: Initial surge from the accumulation zone (around ~$2.00) towards ~$3.30–$3.50. Wave 2: Pullback towards the major support zone around $2.05 – $2.60 (completed base). Wave 3 (In Progress): Strong bullish breakout pushing out of the consolidation range, targeting resistance near $6.00. Wave 4 (Anticipated): Retracement/retest back to the major horizontal support level at ~$4.67. Wave 5 (Anticipated): Final impulse leg driving price towards the macro resistance level at ~$8.00 - $9.00.

Disclaimer
The information and publications are not meant to be, and do not constitute, financial, investment, trading, or other types of advice or recommendations supplied or endorsed by TradingView. Read more in the Terms of Use.
Disclaimer
The information and publications are not meant to be, and do not constitute, financial, investment, trading, or other types of advice or recommendations supplied or endorsed by TradingView. Read more in the Terms of Use.