
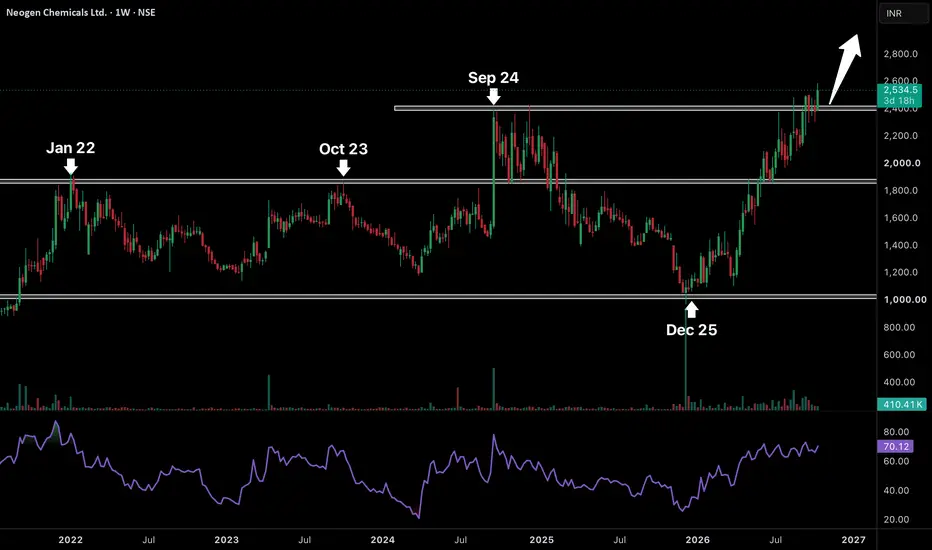
The stock is showing one of the strongest reversal structures on the weekly chart. After spending almost four years moving between major support and resistance zones the stock is finally attempting to break above its September 2024 high. If we look at the previous structure the 1850–1900 zone acted as strong resistance in January 2022 and October 2023. Once this level was broken in September 2024 the stock rallied sharply towards 2400 but failed to sustain and entered another major correction. The decline continued until December 2025 when buyers aggressively defended the long-term support near 1000. Since then the entire structure has changed. The stock has recovered more than 140% from its bottom and successfully reclaimed the previous resistance around 1900. More importantly every recent correction has been relatively shallow which shows buyers are willing to accumulate at higher prices rather than waiting for a deeper fall.
Now the stock is attempting a major multiyear breakout above 2400–2450 which has been its strongest resistance since September 2024. The latest weekly candle has pushed price towards 2535 and RSI is above 70 which reflects strong bullish momentum. This is an important development because the stock is not just recovering its previous losses anymore. It is trying to enter a completely new price discovery phase. Traders who have been waiting to exit near their previous buying levels may have already created supply around this zone and once that supply gets absorbed there could be very little historical resistance left above. If Neogen sustains above 2450 on the weekly timeframe then 2800–3000 becomes the next potential upside zone with scope for a much bigger rally over the coming months. A successful retest of the breakout zone would make the structure even stronger. After years of consolidation and repeated resistance tests this breakout could mark the beginning of a completely new bullish cycle.
Now the stock is attempting a major multiyear breakout above 2400–2450 which has been its strongest resistance since September 2024. The latest weekly candle has pushed price towards 2535 and RSI is above 70 which reflects strong bullish momentum. This is an important development because the stock is not just recovering its previous losses anymore. It is trying to enter a completely new price discovery phase. Traders who have been waiting to exit near their previous buying levels may have already created supply around this zone and once that supply gets absorbed there could be very little historical resistance left above. If Neogen sustains above 2450 on the weekly timeframe then 2800–3000 becomes the next potential upside zone with scope for a much bigger rally over the coming months. A successful retest of the breakout zone would make the structure even stronger. After years of consolidation and repeated resistance tests this breakout could mark the beginning of a completely new bullish cycle.
Trade active
200 Points Up 🚀🚀

📌 Join Trading Community 👇
Telegram : 👉telegram.me/chartifyy
Instagram: 👉 instagram.com/chartifyig?igsi=Y2ZiODZtczZ2aDA=&utm_source=qr
Telegram : 👉telegram.me/chartifyy
Instagram: 👉 instagram.com/chartifyig?igsi=Y2ZiODZtczZ2aDA=&utm_source=qr
Disclaimer
The information and publications are not meant to be, and do not constitute, financial, investment, trading, or other types of advice or recommendations supplied or endorsed by TradingView. Read more in the Terms of Use.
📌 Join Trading Community 👇
Telegram : 👉telegram.me/chartifyy
Instagram: 👉 instagram.com/chartifyig?igsi=Y2ZiODZtczZ2aDA=&utm_source=qr
Telegram : 👉telegram.me/chartifyy
Instagram: 👉 instagram.com/chartifyig?igsi=Y2ZiODZtczZ2aDA=&utm_source=qr
Disclaimer
The information and publications are not meant to be, and do not constitute, financial, investment, trading, or other types of advice or recommendations supplied or endorsed by TradingView. Read more in the Terms of Use.