Long
NEOUSD 4h long setup
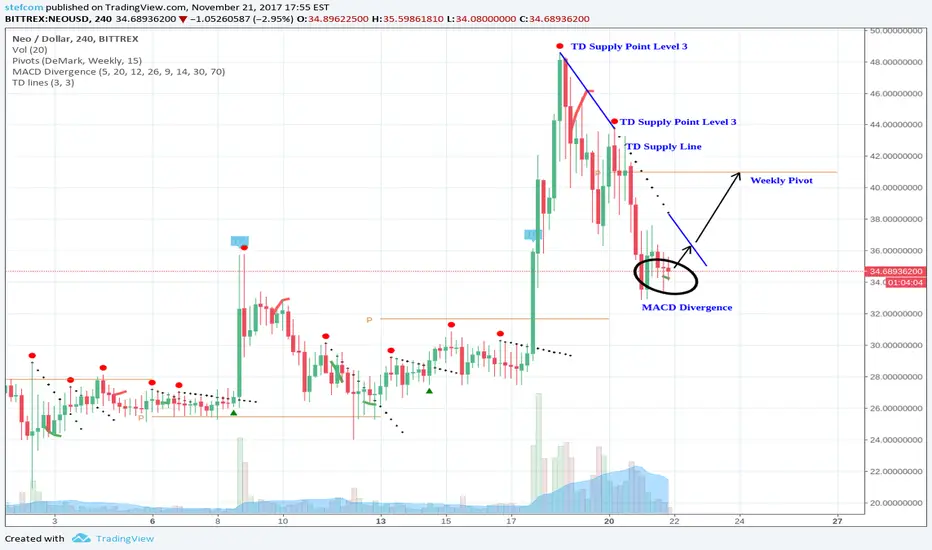
The NEOUSD 4h chart shows a Divergence of Price vs the MACD histogram.
The divergence appeared below a TD Supply Line and could indicate a trend-reversal.
When price breaks the TD Supply Line it could go up to the weekly pivot.
The divergence appeared below a TD Supply Line and could indicate a trend-reversal.
When price breaks the TD Supply Line it could go up to the weekly pivot.

⚡ Signals & Indicator & Strategy & Daily/ Weekly VIP Briefings: tradingclue.com/
⚡ GET THE CCIDivergence INDICATOR FOR FREE: bit.ly/FreeTradingViewIndicator
⚡ FREE Daily Briefings via Telegram: t.me/TradingClueBriefings
⚡ GET THE CCIDivergence INDICATOR FOR FREE: bit.ly/FreeTradingViewIndicator
⚡ FREE Daily Briefings via Telegram: t.me/TradingClueBriefings
Related publications
Disclaimer
The information and publications are not meant to be, and do not constitute, financial, investment, trading, or other types of advice or recommendations supplied or endorsed by TradingView. Read more in the Terms of Use.