
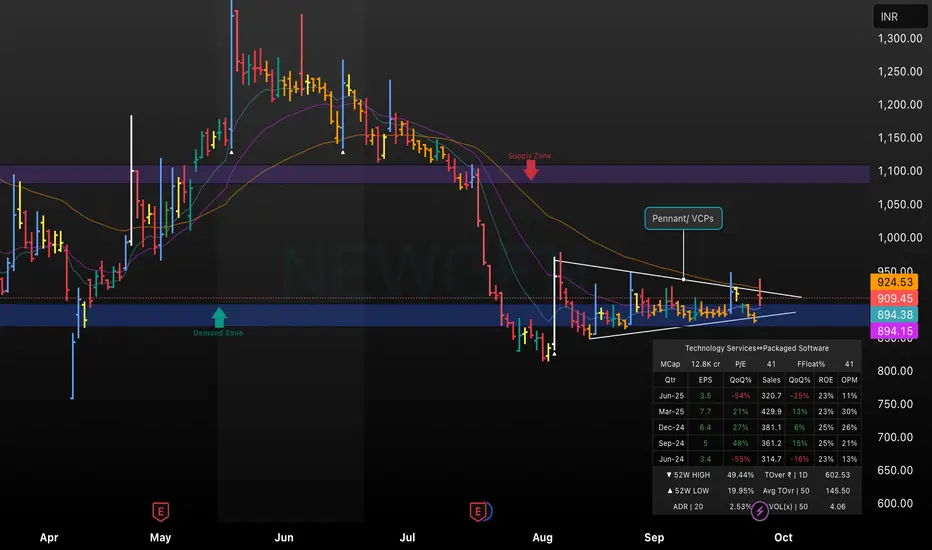
This chart analyzes NEWGEN’s price action around significant demand and supply zones, with a focus on the ongoing pennant/VCP (Volatility Contraction Pattern) base near support. Key moving averages provide context for recent trend shifts, while the technical summary and quarterly performance box support deeper analysis. Watch for breakout moves above the pennant resistance or further demand zone reactions as these will determine the next directional bias.

Disclaimer
The information and publications are not meant to be, and do not constitute, financial, investment, trading, or other types of advice or recommendations supplied or endorsed by TradingView. Read more in the Terms of Use.
Disclaimer
The information and publications are not meant to be, and do not constitute, financial, investment, trading, or other types of advice or recommendations supplied or endorsed by TradingView. Read more in the Terms of Use.