
NIFTY 50 | Daily Chart | Elliott Wave Analysis
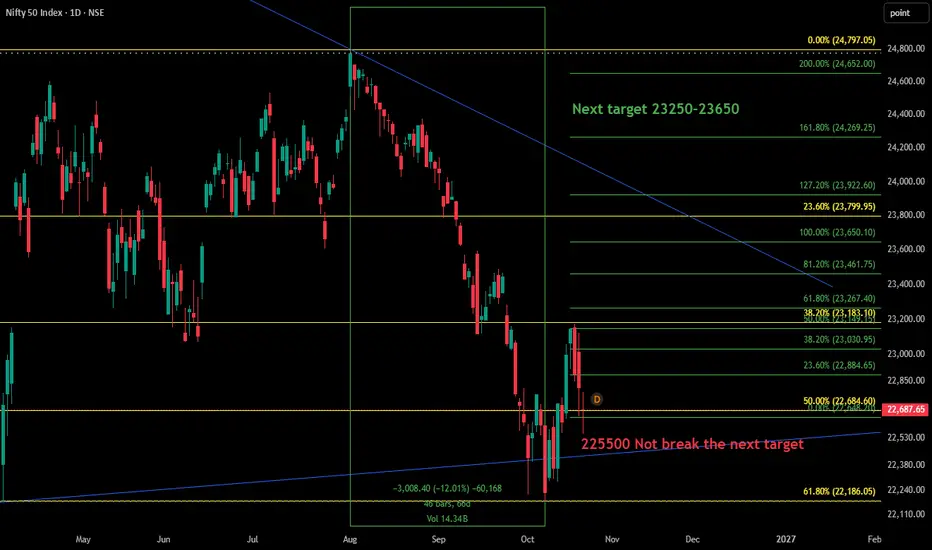
NIFTY 50 is struggling to break below the crucial 22,500 support zone. As long as this level holds, the possibility of a bullish recovery remains on the table.
Based on the Elliott Wave perspective, the lower timeframes may be preparing for the beginning of a new impulsive move, provided price action confirms the reversal.
Key Levels to Watch
Major Support: 22,500
Initial Upside Target: 23,250–23,650
Immediate Resistance Zone: 23,000–23,200
Critical Support Failure: A decisive breakdown below 22,500 could invalidate the bullish recovery scenario and expose lower levels.
Elliott Wave Perspective
The current price structure suggests that the corrective decline may be approaching an important support area. If NIFTY holds above 22,500 and bullish momentum develops on the lower timeframes, a fresh impulsive wave could begin.
The initial upside targets are marked on the chart. Price confirmation and follow-through will be essential before assuming that the next upward leg is underway.
Higher-Timeframe Context
I have already shared my previous NIFTY analysis on the weekly timeframe. This daily-chart update focuses on the critical 22,500 level and the potential next move from the current support zone.
Key Observation: Watch how price behaves around 22,500. A sustained hold could open the path toward 23,250–23,650, while a decisive breakdown would require reassessing the bullish outlook.
This is a technical analysis scenario, not a guaranteed market direction. Elliott Wave counts are subjective and should be validated by actual price action.
#NIFTY50 #ElliottWave #TechnicalAnalysis
NIFTY 50 is struggling to break below the crucial 22,500 support zone. As long as this level holds, the possibility of a bullish recovery remains on the table.
Based on the Elliott Wave perspective, the lower timeframes may be preparing for the beginning of a new impulsive move, provided price action confirms the reversal.
Key Levels to Watch
Major Support: 22,500
Initial Upside Target: 23,250–23,650
Immediate Resistance Zone: 23,000–23,200
Critical Support Failure: A decisive breakdown below 22,500 could invalidate the bullish recovery scenario and expose lower levels.
Elliott Wave Perspective
The current price structure suggests that the corrective decline may be approaching an important support area. If NIFTY holds above 22,500 and bullish momentum develops on the lower timeframes, a fresh impulsive wave could begin.
The initial upside targets are marked on the chart. Price confirmation and follow-through will be essential before assuming that the next upward leg is underway.
Higher-Timeframe Context
I have already shared my previous NIFTY analysis on the weekly timeframe. This daily-chart update focuses on the critical 22,500 level and the potential next move from the current support zone.
Key Observation: Watch how price behaves around 22,500. A sustained hold could open the path toward 23,250–23,650, while a decisive breakdown would require reassessing the bullish outlook.
This is a technical analysis scenario, not a guaranteed market direction. Elliott Wave counts are subjective and should be validated by actual price action.
#NIFTY50 #ElliottWave #TechnicalAnalysis
Trade active
## NIFTY 50 Update: 22,500 Support Analysis — Upside Target AchievedThe price action has played out in line with the bullish recovery scenario discussed in my October 22 analysis.
**What happened after the original publication?**
- Original major support: 22,500
- Subsequent swing low: 22,373
- Price reversed from the lower zone.
- Initial upside target zone: 23,250–23,650
- NIFTY reached 23,250 and achieved the initial target.
- Latest closing price: 23,440.
### Market Observation
Although NIFTY briefly moved below the identified 22,500 support, the subsequent recovery confirmed strong buying interest at lower levels.
The index has now entered the originally projected upside target zone.
### What's Next?
The next important area to watch is 23,500–23,650.
A sustained move above this zone could open the possibility of further upside. Failure to sustain above it may lead to consolidation or a short-term pullback.
**The original analysis remains unchanged. This post documents the actual market development against the published outlook.**

Disclaimer
The information and publications are not meant to be, and do not constitute, financial, investment, trading, or other types of advice or recommendations supplied or endorsed by TradingView. Read more in the Terms of Use.
Disclaimer
The information and publications are not meant to be, and do not constitute, financial, investment, trading, or other types of advice or recommendations supplied or endorsed by TradingView. Read more in the Terms of Use.