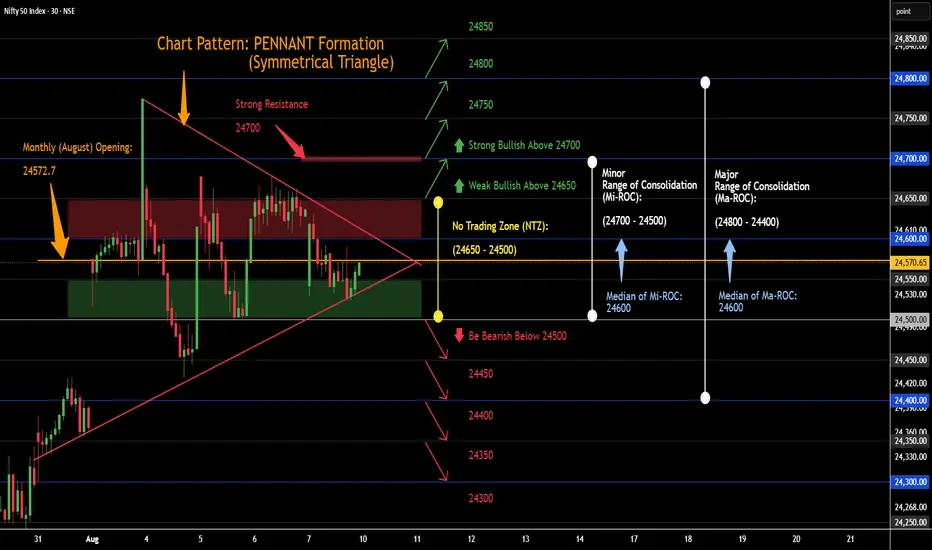
Probable Scenario Analysis and Trade Plan for the Nifty 50 Index  NIFTY for the 10th of August, 2026. The day is Monday.
🟢 Bullish Scenario
Presently, there is no bullish scenario. For a bullish scenario to emerge, the price has to sustain above level 24650 with an exclusive green marubozu candle. The probable weak bullish target above 24650 would be - 24700. There will be strong resistance at 24700. Next, if the price sustains above 24700, then a strong bullish move would emerge. The probable strong bullish targets above 24700 would be - 24750, 24800, and 24850.
🔴 Bearish Scenario
Presently, there is no bearish setup. The market is sideways. Level 24500 is strong support. A decisive breakdown below 24500 would trigger a bearish setup. There must be one exclusive red bearish candle formation below 24500. Also, the price must sustain below 24500 with a tendency to go lower. The probable bearish targets below 24500 would be - 24450, 24400, 24350, and 24300.
🟡 No Trading Zone (NTZ): (24650 - 24500).
⏺ Minor Range of Consolidation (Mi-ROC): (24700 - 24500).
Here, 24600 is the median of the Mi-ROC. The median works like a trading session sentiment evaluator. The price trading above the median would offer bullish sentiment, while the price trading below the median would trigger bearish sentiment within the ROC.
⏺ Major Range of Consolidation (Ma-ROC): (24800 - 24400).
Here, 24600 is the median of the Ma-ROC. The median works like a trading session sentiment evaluator. The price trading above the median would offer bullish sentiment, while the price trading below the median would trigger bearish sentiment within the ROC.
● Event
There is no major event or holiday. But geopolitical issues are omnipresent and beyond our control.
● Intraday, Weekly, and Monthly Bias
Establish bias with respect to the opening price (of the particular session - Intraday, Weekly, and Monthly). If the price sustains above the opening price, then don't think of shorting. Look for bullish trades only. On the contrary, if the price sustains below the opening price, then don't think of going long. Look for bearish trades in that case.
● Disclaimer + End Note
- All the analyses would fail in the case of a major gap up, gap down, or price structure anomaly. Thus, practice PRAGMATISM in the live session.
- Trade only if there is a set-up. Remember, not trading is an extension of the trading activity.
- Mark your points. Trade your points. Price is GOD. Anything can happen in the markets. Thus, trade what you see, not what you believe.
- Always PRACTICE RISK MANAGEMENT. Always PROTECT YOUR CAPITAL. Be RESPONSIBLE.
- Be Strategic. Be Courageous. Be Patient. Be Wise.
- Every day is a new day. Thus, do not carry the baggage of past successes or failures. Leave the gardens of winning and losing. Establish yourself in equanimity. Always think from a new perspective.
- Let the joy of trading drive your effectiveness, not greed or fear. Believe in Possibilities.
Happy Trading!
NIFTY for the 10th of August, 2026. The day is Monday.🟢 Bullish Scenario
Presently, there is no bullish scenario. For a bullish scenario to emerge, the price has to sustain above level 24650 with an exclusive green marubozu candle. The probable weak bullish target above 24650 would be - 24700. There will be strong resistance at 24700. Next, if the price sustains above 24700, then a strong bullish move would emerge. The probable strong bullish targets above 24700 would be - 24750, 24800, and 24850.
🔴 Bearish Scenario
Presently, there is no bearish setup. The market is sideways. Level 24500 is strong support. A decisive breakdown below 24500 would trigger a bearish setup. There must be one exclusive red bearish candle formation below 24500. Also, the price must sustain below 24500 with a tendency to go lower. The probable bearish targets below 24500 would be - 24450, 24400, 24350, and 24300.
🟡 No Trading Zone (NTZ): (24650 - 24500).
⏺ Minor Range of Consolidation (Mi-ROC): (24700 - 24500).
Here, 24600 is the median of the Mi-ROC. The median works like a trading session sentiment evaluator. The price trading above the median would offer bullish sentiment, while the price trading below the median would trigger bearish sentiment within the ROC.
⏺ Major Range of Consolidation (Ma-ROC): (24800 - 24400).
Here, 24600 is the median of the Ma-ROC. The median works like a trading session sentiment evaluator. The price trading above the median would offer bullish sentiment, while the price trading below the median would trigger bearish sentiment within the ROC.
● Event
There is no major event or holiday. But geopolitical issues are omnipresent and beyond our control.
● Intraday, Weekly, and Monthly Bias
Establish bias with respect to the opening price (of the particular session - Intraday, Weekly, and Monthly). If the price sustains above the opening price, then don't think of shorting. Look for bullish trades only. On the contrary, if the price sustains below the opening price, then don't think of going long. Look for bearish trades in that case.
● Disclaimer + End Note
- All the analyses would fail in the case of a major gap up, gap down, or price structure anomaly. Thus, practice PRAGMATISM in the live session.
- Trade only if there is a set-up. Remember, not trading is an extension of the trading activity.
- Mark your points. Trade your points. Price is GOD. Anything can happen in the markets. Thus, trade what you see, not what you believe.
- Always PRACTICE RISK MANAGEMENT. Always PROTECT YOUR CAPITAL. Be RESPONSIBLE.
- Be Strategic. Be Courageous. Be Patient. Be Wise.
- Every day is a new day. Thus, do not carry the baggage of past successes or failures. Leave the gardens of winning and losing. Establish yourself in equanimity. Always think from a new perspective.
- Let the joy of trading drive your effectiveness, not greed or fear. Believe in Possibilities.
Happy Trading!

Related publications
Disclaimer
The information and publications are not meant to be, and do not constitute, financial, investment, trading, or other types of advice or recommendations supplied or endorsed by TradingView. Read more in the Terms of Use.
Related publications
Disclaimer
The information and publications are not meant to be, and do not constitute, financial, investment, trading, or other types of advice or recommendations supplied or endorsed by TradingView. Read more in the Terms of Use.