
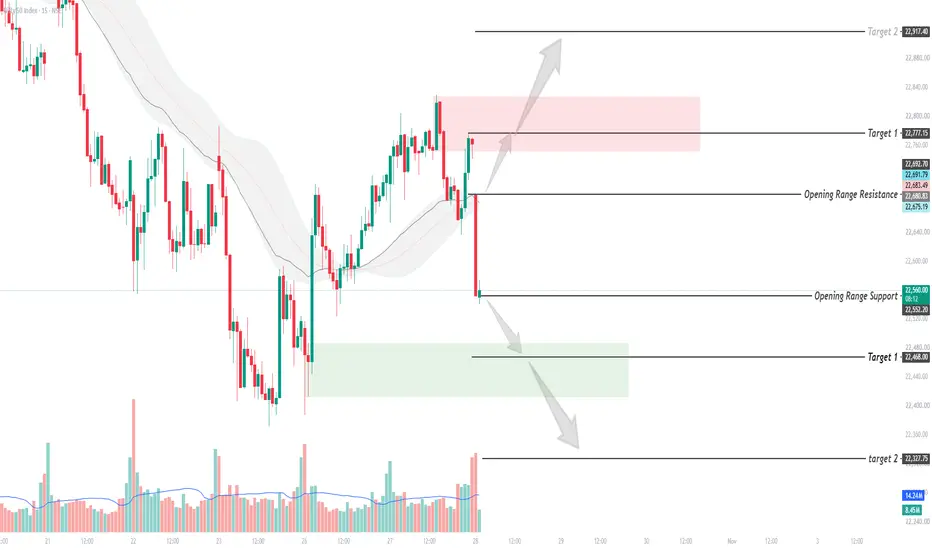
📊 **NIFTY 15-Min: Sharp Opening Sell-Off Tests Key Support**
NIFTY opened weak and faced aggressive selling from the 22,680 resistance area.
Price has now dropped directly toward the important 22,560 opening support.
The broader intraday structure remains bearish below the declining resistance structure, but price is already sitting near support, so chasing PE at current levels may offer poor risk-reward.
That makes 22,680 resistance and 22,560 support the key levels for the next directional move.
---
📌 **Important Levels**
Resistance:
• 22,620
Upside Targets:
• 22,680
• 22,780
• 22,920
Support:
• 22,560
Downside Targets:
• 22,470
• 22,420
• 22,330
---
📉 **Bearish Plan**
If NIFTY breaks and sustains below 22,560:
• PE after bearish confirmation
• Prefer breakdown + failed reclaim
• Targets: 22,510 / 22,470 / 22,420
Below 22,470:
• Downside momentum can strengthen further
• Targets: 22,420 / 22,390 / 22,330
Alternatively, if NIFTY recovers toward 22,610–22,650 and gets rejected:
• PE after lower-high confirmation
• Targets: 22,580 / 22,560 / 22,510
Do not chase PE directly near 22,560 after the sharp opening fall.
---
📈 **Bullish Plan**
If NIFTY reclaims and sustains above 22,620:
• Short-covering recovery can develop
• Targets: 22,650 / 22,680
Stronger CE confirmation comes only above 22,680.
Targets:
• 22,720
• 22,780
• 22,920
Above 22,780, the broader recovery structure becomes considerably stronger.
Do not buy CE merely because price reacts from 22,560.
Buyers need to reclaim resistance first.
---
🌍 **Market Context**
Indian equities opened broadly weak, with IT stocks leading the decline.
Crude oil has moved above $115 as renewed Middle East supply risks increase inflation and import-cost concerns for India.
The US Federal Reserve policy decision is due today, keeping global markets cautious ahead of its guidance on future interest rates.
Foreign investor outflows also remain an important headwind for Indian equities.
---
✅ **Final View**
Above 22,620 → short-covering recovery improves
Above 22,680 → bullish recovery strengthens
Above 22,780 → stronger reversal possible
Reject 22,610–22,650 → sellers retain the advantage
Below 22,560 → bearish continuation
Below 22,470 → downside momentum strengthens
Inside 22,560–22,620 → WAIT
Educational analysis only. Trade with confirmation and disciplined risk management.
NIFTY opened weak and faced aggressive selling from the 22,680 resistance area.
Price has now dropped directly toward the important 22,560 opening support.
The broader intraday structure remains bearish below the declining resistance structure, but price is already sitting near support, so chasing PE at current levels may offer poor risk-reward.
That makes 22,680 resistance and 22,560 support the key levels for the next directional move.
---
📌 **Important Levels**
Resistance:
• 22,620
Upside Targets:
• 22,680
• 22,780
• 22,920
Support:
• 22,560
Downside Targets:
• 22,470
• 22,420
• 22,330
---
📉 **Bearish Plan**
If NIFTY breaks and sustains below 22,560:
• PE after bearish confirmation
• Prefer breakdown + failed reclaim
• Targets: 22,510 / 22,470 / 22,420
Below 22,470:
• Downside momentum can strengthen further
• Targets: 22,420 / 22,390 / 22,330
Alternatively, if NIFTY recovers toward 22,610–22,650 and gets rejected:
• PE after lower-high confirmation
• Targets: 22,580 / 22,560 / 22,510
Do not chase PE directly near 22,560 after the sharp opening fall.
---
📈 **Bullish Plan**
If NIFTY reclaims and sustains above 22,620:
• Short-covering recovery can develop
• Targets: 22,650 / 22,680
Stronger CE confirmation comes only above 22,680.
Targets:
• 22,720
• 22,780
• 22,920
Above 22,780, the broader recovery structure becomes considerably stronger.
Do not buy CE merely because price reacts from 22,560.
Buyers need to reclaim resistance first.
---
🌍 **Market Context**
Indian equities opened broadly weak, with IT stocks leading the decline.
Crude oil has moved above $115 as renewed Middle East supply risks increase inflation and import-cost concerns for India.
The US Federal Reserve policy decision is due today, keeping global markets cautious ahead of its guidance on future interest rates.
Foreign investor outflows also remain an important headwind for Indian equities.
---
✅ **Final View**
Above 22,620 → short-covering recovery improves
Above 22,680 → bullish recovery strengthens
Above 22,780 → stronger reversal possible
Reject 22,610–22,650 → sellers retain the advantage
Below 22,560 → bearish continuation
Below 22,470 → downside momentum strengthens
Inside 22,560–22,620 → WAIT
Educational analysis only. Trade with confirmation and disciplined risk management.

⭐For Live Trading Courses And Trading Community 📈
Contact ⬇️
📱wa.me/919322295961
📱t.me/+UgF9lES_XxA0MTk9
⭐Advanced courses
⭐Fully Automated Algo Trading
⭐Daily F&O Trade tips
📱 t.me/+UgF9lES_XxA0MTk9
Contact ⬇️
📱wa.me/919322295961
📱t.me/+UgF9lES_XxA0MTk9
⭐Advanced courses
⭐Fully Automated Algo Trading
⭐Daily F&O Trade tips
📱 t.me/+UgF9lES_XxA0MTk9
Related publications
Disclaimer
The information and publications are not meant to be, and do not constitute, financial, investment, trading, or other types of advice or recommendations supplied or endorsed by TradingView. Read more in the Terms of Use.
⭐For Live Trading Courses And Trading Community 📈
Contact ⬇️
📱wa.me/919322295961
📱t.me/+UgF9lES_XxA0MTk9
⭐Advanced courses
⭐Fully Automated Algo Trading
⭐Daily F&O Trade tips
📱 t.me/+UgF9lES_XxA0MTk9
Contact ⬇️
📱wa.me/919322295961
📱t.me/+UgF9lES_XxA0MTk9
⭐Advanced courses
⭐Fully Automated Algo Trading
⭐Daily F&O Trade tips
📱 t.me/+UgF9lES_XxA0MTk9
Related publications
Disclaimer
The information and publications are not meant to be, and do not constitute, financial, investment, trading, or other types of advice or recommendations supplied or endorsed by TradingView. Read more in the Terms of Use.