
Overview
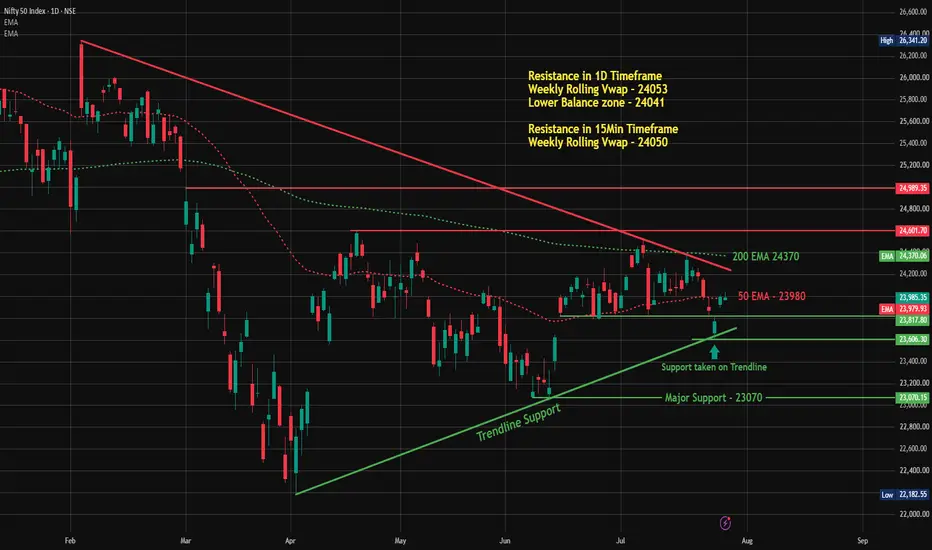
NIFTY found support near the rising trendline once again, keeping the broader structure intact for now. However, price is still trading below the short-term moving averages, suggesting buyers need further confirmation before momentum can improve.
The next session is likely to revolve around whether the index can reclaim the nearby resistance cluster.
Key Levels
🟢 Support
23,817 – Immediate support
23,606 – Trendline support
23,070 – Major structural support
🔴 Resistance
23,980 – 50 EMA
24,370 – 200 EMA
24,041–24,053 – Daily Balance Zone / Weekly Rolling VWAP
24,050 – 15-minute Weekly Rolling VWAP
24,602 – Higher resistance
What to Watch Tomorrow
🟢 Bullish Scenario
If buyers continue defending the trendline and reclaim the 24,041–24,053 resistance area with acceptance, the market may attempt to retest the 50 EMA (23,980) and later the 200 EMA (24,370). A sustained move above these levels would strengthen the short-term structure.
🔴 Bearish Scenario
If price loses 23,817, attention shifts to the trendline support near 23,606. A break below this area would expose the next major support around 23,070.
Market Structure
The rising trendline remains an important reference. As long as it holds, buyers still have an opportunity to rebuild momentum. The key question for the next session is whether price can reclaim the nearby resistance cluster or continue respecting it as supply.
Educational market structure discussion only. Not investment advice.
NIFTY found support near the rising trendline once again, keeping the broader structure intact for now. However, price is still trading below the short-term moving averages, suggesting buyers need further confirmation before momentum can improve.
The next session is likely to revolve around whether the index can reclaim the nearby resistance cluster.
Key Levels
🟢 Support
23,817 – Immediate support
23,606 – Trendline support
23,070 – Major structural support
🔴 Resistance
23,980 – 50 EMA
24,370 – 200 EMA
24,041–24,053 – Daily Balance Zone / Weekly Rolling VWAP
24,050 – 15-minute Weekly Rolling VWAP
24,602 – Higher resistance
What to Watch Tomorrow
🟢 Bullish Scenario
If buyers continue defending the trendline and reclaim the 24,041–24,053 resistance area with acceptance, the market may attempt to retest the 50 EMA (23,980) and later the 200 EMA (24,370). A sustained move above these levels would strengthen the short-term structure.
🔴 Bearish Scenario
If price loses 23,817, attention shifts to the trendline support near 23,606. A break below this area would expose the next major support around 23,070.
Market Structure
The rising trendline remains an important reference. As long as it holds, buyers still have an opportunity to rebuild momentum. The key question for the next session is whether price can reclaim the nearby resistance cluster or continue respecting it as supply.
Educational market structure discussion only. Not investment advice.
Trade closed: target reached
Update — Target Achieved ✅The original thesis (Jul 28) flagged Nifty holding trendline support, with the bullish path needing a reclaim of the 24,041–24,053 resistance cluster, followed by the 200 EMA (24,370) and then higher resistance at 24,602.
All of these played out. Nifty reclaimed the resistance cluster, pushed through the 200 EMA, and rallied to a high of 24,774.30 on Aug 3, clearing the 24,602 level as well.
Price has since pulled back and is now consolidating between the 200 EMA (24,384) and 24,601 support, currently at 24,471.70, within the broader resistance zone (24,601–24,989) covered in our subsequent weekly updates.
Closing this update here.

📈 HK Trading Community | Market Structure & Indicator Updates
Telegram: t.me/trendstrike1000
Website: quantumedgepro.netlify.app/
Real traders are built through learning,not tip hunting.So Start Learning How the Market Really Works
Telegram: t.me/trendstrike1000
Website: quantumedgepro.netlify.app/
Real traders are built through learning,not tip hunting.So Start Learning How the Market Really Works
Related publications
Disclaimer
The information and publications are not meant to be, and do not constitute, financial, investment, trading, or other types of advice or recommendations supplied or endorsed by TradingView. Read more in the Terms of Use.
📈 HK Trading Community | Market Structure & Indicator Updates
Telegram: t.me/trendstrike1000
Website: quantumedgepro.netlify.app/
Real traders are built through learning,not tip hunting.So Start Learning How the Market Really Works
Telegram: t.me/trendstrike1000
Website: quantumedgepro.netlify.app/
Real traders are built through learning,not tip hunting.So Start Learning How the Market Really Works
Related publications
Disclaimer
The information and publications are not meant to be, and do not constitute, financial, investment, trading, or other types of advice or recommendations supplied or endorsed by TradingView. Read more in the Terms of Use.