
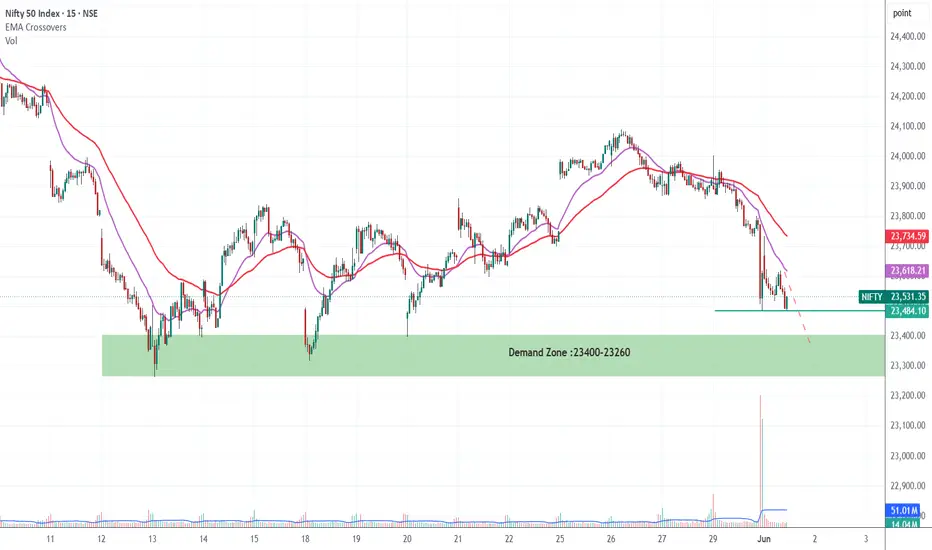
NIFTY is showing weakness on the 15-minute chart, hourly chart even daily chart as price continues trading below both EMAs, indicating bearish momentum. A sharp breakdown with strong volume confirms seller dominance, while the 23400–23260 demand zone is now the key area to watch. If buyers defend this zone, a short-term bounce is possible, but a breakdown below it may trigger further downside pressure.
Trade active
Now Nifty Entered into Demand Zone, it may remain Sidways for sometimeTrade closed: target reached

Disclaimer
The information and publications are not meant to be, and do not constitute, financial, investment, trading, or other types of advice or recommendations supplied or endorsed by TradingView. Read more in the Terms of Use.
Disclaimer
The information and publications are not meant to be, and do not constitute, financial, investment, trading, or other types of advice or recommendations supplied or endorsed by TradingView. Read more in the Terms of Use.