
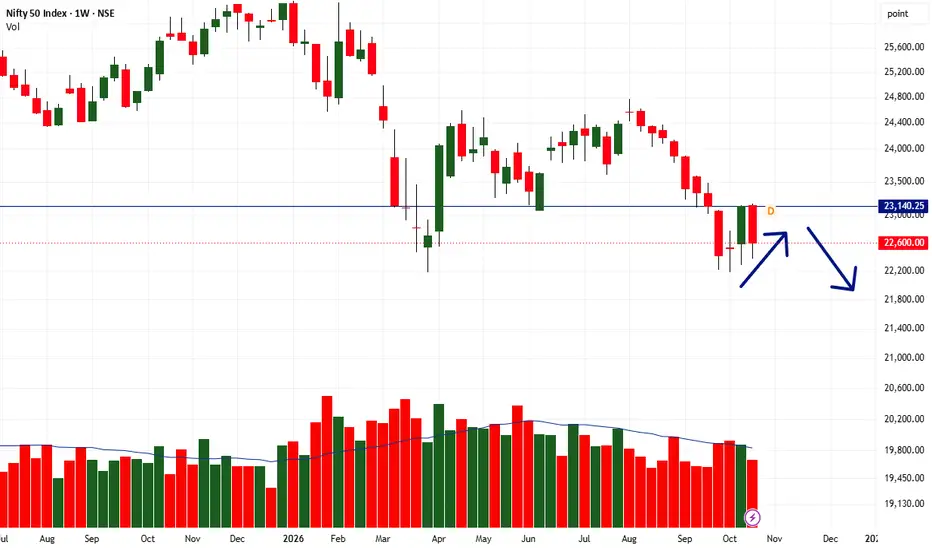
🔻 Nifty has formed a potential Tweezer Top pattern, indicating selling pressure near the 23,150–23,175 zone.
⚠️ The index has also broken below the 100-week Moving Average (around 22,673), signalling weakness in the broader trend.
📍 Key Levels to Watch:
🔹 Resistance: 23,150–23,175
🔹 Support: 22,370–22,400
🔹 Next Support: 22,000
🔹 Further Downside: 21,500–21,600
A sustained break below 22,370 could trigger further downside. However, reclaiming 22,673 and sustaining above it would be an early sign of recovery.
⚠️ These levels are based on the chart shared. Watch for price confirmation and manage risk carefully.
⚠️ The index has also broken below the 100-week Moving Average (around 22,673), signalling weakness in the broader trend.
📍 Key Levels to Watch:
🔹 Resistance: 23,150–23,175
🔹 Support: 22,370–22,400
🔹 Next Support: 22,000
🔹 Further Downside: 21,500–21,600
A sustained break below 22,370 could trigger further downside. However, reclaiming 22,673 and sustaining above it would be an early sign of recovery.
⚠️ These levels are based on the chart shared. Watch for price confirmation and manage risk carefully.

Disclaimer
The information and publications are not meant to be, and do not constitute, financial, investment, trading, or other types of advice or recommendations supplied or endorsed by TradingView. Read more in the Terms of Use.
Disclaimer
The information and publications are not meant to be, and do not constitute, financial, investment, trading, or other types of advice or recommendations supplied or endorsed by TradingView. Read more in the Terms of Use.