
More exclusive indicators from AfnanTAjuddin
Subscribe to Supply & Demand Price Action Toolkit for $8.49/month to get exclusive indicators by this author. You pay right on TradingView and can use them on your charts straight away.
Explore Supply & Demand Price Action Toolkit🌍 The Bigger Picture Favors the Buyers 🌍
At first glance, NIFTY may appear to be moving sideways, but a closer look reveals an interesting story developing beneath the surface.
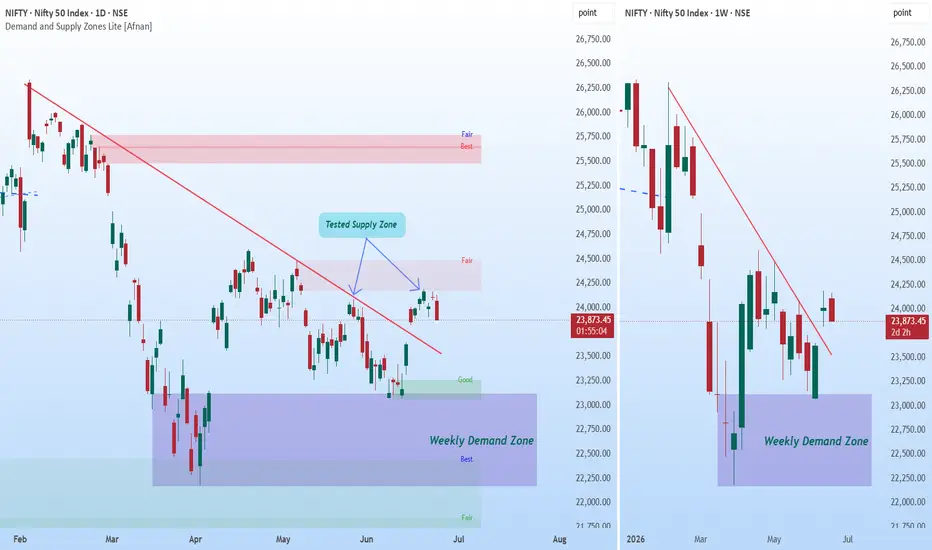
The most important area on this chart is the Weekly Demand Zone. This higher timeframe demand area has already demonstrated its strength by attracting buyers and preventing further downside. Recently, price revisited this zone and immediately found support, suggesting that institutional demand may still be active.
Higher timeframe zones often carry greater significance because they reflect decisions made by larger market participants. As long as this Weekly Demand Zone remains intact, the broader structure remains constructive.
📈 Daily Demand Emerging Inside Weekly Demand 📈
One of the strongest observations on this chart is the formation of a Daily Demand Zone within the larger Weekly Demand Zone.
This creates a powerful alignment between timeframes.
When a Daily Demand Zone forms inside an active Weekly Demand Zone, it often indicates that buyers are becoming active at multiple levels of the market.
The recent rally originated from this Daily Demand Zone, showing that buyers were willing to step in before price could move deeper into the Weekly Demand area.
This is exactly the type of behavior bulls want to see.
🔥 The Trendline Breakout Changes the Story 🔥
For several months, NIFTY remained under pressure from a falling trendline that guided the correction lower.
That situation has now changed.
Price has successfully broken above the descending trendline, which suggests that bearish momentum is weakening and market character may be shifting.
More importantly, after the breakout, price did not collapse back below the trendline. Instead, it has been consolidating above it.
This is often a healthier sign than a breakout followed by immediate rejection.
The Role of the Daily Supply Zone
The next important area on the chart is the Daily Supply Zone overhead.
This zone has already been tested previously, making it a key battleground between buyers and sellers.
Many traders focus only on the existence of supply, but the more interesting observation is that price continues to challenge this area after bouncing from demand.
This behavior can sometimes indicate that selling pressure is gradually being absorbed.
🎯 What the Price Action Is Telling Us 🎯
The current structure is no longer showing the characteristics of a strong downtrend.
Instead, the market appears to be transitioning into a phase of consolidation after a successful bounce from higher timeframe demand.
This doesn't guarantee a bullish move, but it does suggest that the market is in a much stronger position than it was during the decline.
🚦 What Traders Should Watch Next 🚦
Bullish Scenario
Bearish Scenario
💡 Final Thoughts 💡
The most compelling aspect of this chart is not the Daily Supply Zone overhead, but the confluence between the Daily Demand Zone and the Weekly Demand Zone below.
This alignment, combined with the successful breakout above the falling trendline, suggests that buyers have started to regain control after months of corrective price action.
While the Daily Supply Zone remains an important obstacle, the overall structure appears healthier than many traders may initially assume.
The next major clue will come from how price behaves around this Daily Supply Zone. A successful breakout could significantly strengthen the bullish case, while a rejection would likely extend the current consolidation phase.
This analysis is for educational purposes only and should not be considered financial, trading, or investment advice. I am not a SEBI registered analyst.
Thank you for your support, your likes & comments. Feel free to ask if you have questions. 📊
At first glance, NIFTY may appear to be moving sideways, but a closer look reveals an interesting story developing beneath the surface.
The most important area on this chart is the Weekly Demand Zone. This higher timeframe demand area has already demonstrated its strength by attracting buyers and preventing further downside. Recently, price revisited this zone and immediately found support, suggesting that institutional demand may still be active.
Higher timeframe zones often carry greater significance because they reflect decisions made by larger market participants. As long as this Weekly Demand Zone remains intact, the broader structure remains constructive.
📈 Daily Demand Emerging Inside Weekly Demand 📈
One of the strongest observations on this chart is the formation of a Daily Demand Zone within the larger Weekly Demand Zone.
This creates a powerful alignment between timeframes.
When a Daily Demand Zone forms inside an active Weekly Demand Zone, it often indicates that buyers are becoming active at multiple levels of the market.
The recent rally originated from this Daily Demand Zone, showing that buyers were willing to step in before price could move deeper into the Weekly Demand area.
This is exactly the type of behavior bulls want to see.
🔥 The Trendline Breakout Changes the Story 🔥
For several months, NIFTY remained under pressure from a falling trendline that guided the correction lower.
That situation has now changed.
Price has successfully broken above the descending trendline, which suggests that bearish momentum is weakening and market character may be shifting.
More importantly, after the breakout, price did not collapse back below the trendline. Instead, it has been consolidating above it.
This is often a healthier sign than a breakout followed by immediate rejection.
The Role of the Daily Supply Zone
The next important area on the chart is the Daily Supply Zone overhead.
This zone has already been tested previously, making it a key battleground between buyers and sellers.
Many traders focus only on the existence of supply, but the more interesting observation is that price continues to challenge this area after bouncing from demand.
- Buyers defended the Daily Demand Zone.
- Price broke the falling trendline.
- The market recovered from the Weekly Demand Zone.
- Price is now holding near Daily Supply instead of getting aggressively rejected.
This behavior can sometimes indicate that selling pressure is gradually being absorbed.
🎯 What the Price Action Is Telling Us 🎯
The current structure is no longer showing the characteristics of a strong downtrend.
Instead, the market appears to be transitioning into a phase of consolidation after a successful bounce from higher timeframe demand.
- Weekly Demand Zone remains respected.
- Daily Demand Zone successfully generated a rally.
- Falling trendline has been broken.
- Price is consolidating near Daily Supply.
- Sellers have not regained complete control.
This doesn't guarantee a bullish move, but it does suggest that the market is in a much stronger position than it was during the decline.
🚦 What Traders Should Watch Next 🚦
Bullish Scenario
- Daily Demand continues to hold.
- Buyers maintain control above the broken trendline.
- Daily Supply gets absorbed.
- Momentum expands toward higher supply zones.
Bearish Scenario
- Daily Supply produces a strong rejection.
- Price falls back below the breakout area.
- Daily Demand fails to attract buyers.
- Market revisits deeper portions of the Weekly Demand Zone.
💡 Final Thoughts 💡
The most compelling aspect of this chart is not the Daily Supply Zone overhead, but the confluence between the Daily Demand Zone and the Weekly Demand Zone below.
This alignment, combined with the successful breakout above the falling trendline, suggests that buyers have started to regain control after months of corrective price action.
While the Daily Supply Zone remains an important obstacle, the overall structure appears healthier than many traders may initially assume.
The next major clue will come from how price behaves around this Daily Supply Zone. A successful breakout could significantly strengthen the bullish case, while a rejection would likely extend the current consolidation phase.
Great traders don't wait for certainty—they wait for confirmation. 📈🚀
This analysis is for educational purposes only and should not be considered financial, trading, or investment advice. I am not a SEBI registered analyst.
Thank you for your support, your likes & comments. Feel free to ask if you have questions. 📊

Access Demand and Supply Zone Pro indicator at:
tradingview.com/scripts/marketplace/AfnanTAjuddin/
Stay updated on Telegram:
t.me/MarketUp2Date
Join our WhatsApp channel:
whatsapp.com/channel/0029Va6ByyH0LKZCc4Az4x0u
tradingview.com/scripts/marketplace/AfnanTAjuddin/
Stay updated on Telegram:
t.me/MarketUp2Date
Join our WhatsApp channel:
whatsapp.com/channel/0029Va6ByyH0LKZCc4Az4x0u
Related publications
Disclaimer
The information and publications are not meant to be, and do not constitute, financial, investment, trading, or other types of advice or recommendations supplied or endorsed by TradingView. Read more in the Terms of Use.
Access Demand and Supply Zone Pro indicator at:
tradingview.com/scripts/marketplace/AfnanTAjuddin/
Stay updated on Telegram:
t.me/MarketUp2Date
Join our WhatsApp channel:
whatsapp.com/channel/0029Va6ByyH0LKZCc4Az4x0u
tradingview.com/scripts/marketplace/AfnanTAjuddin/
Stay updated on Telegram:
t.me/MarketUp2Date
Join our WhatsApp channel:
whatsapp.com/channel/0029Va6ByyH0LKZCc4Az4x0u
Related publications
Disclaimer
The information and publications are not meant to be, and do not constitute, financial, investment, trading, or other types of advice or recommendations supplied or endorsed by TradingView. Read more in the Terms of Use.