
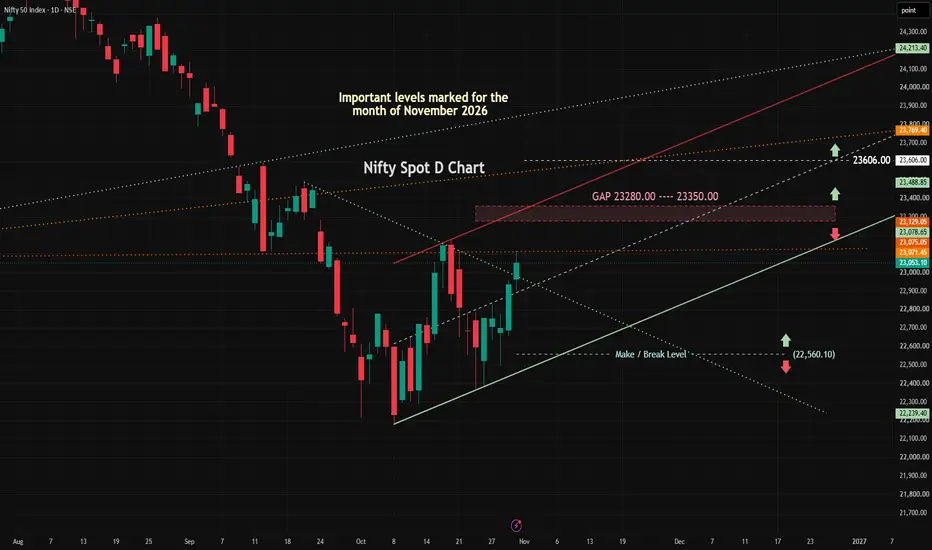
NIFTY 50 (SPOT) – DAILY TECHNICAL OUTLOOK & CHART ANALYSISTarget Period: November 2026
Current Price: 23,053.10
1. MARKET STRUCTURE & PRICE ACTION OVERVIEW
Following a sharp capitulation phase in early-to-mid October that drove the index down toward the 22,200 region, the Nifty 50 has transitioned into a short-term corrective recovery phase.
This recovery is currently defined by a precise Ascending Channel (marked by the solid white rising trendlines). The price action is creating a sequence of higher highs and higher lows within this boundary. However, the angle of ascent is relatively steep compared to the preceding drop, suggesting this may be a bear-flag/corrective bounce rather than a confirmed macro trend reversal. The index is currently compressing near the upper boundary of this channel, facing immediate resistance.
2. PRECISION SUPPORT & RESISTANCE (THE ANNOTATED LEVELS)
The chart clearly maps out the algorithmic and structural pivot levels for the month.
Overhead Resistance (Supply):
23,125.75 – 23,129.05: Immediate local resistance. A rejection here (indicated by the red down arrow) keeps price suppressed within the lower half of the channel.
23,280.00 – 23,350.00 (THE GAP): This is the most critical overhead supply zone on the chart. Unfilled downside gaps act as strong institutional resistance magnets. This zone must be treated as a high-probability rejection area on its first test.
23,488.85 & 23,606.00: Macro breakout targets. A confirmed daily close above the Gap zone opens the door to 23,606 (highlighted by the green continuation arrow).
Downside Support (Demand):
2,980.40: Immediate minor support (recent local pivot).
22,795.05: Intermediate structural support. A break below this invalidates the current ascending channel's lower boundary.
22,560.10 (THE MAKE / BREAK LEVEL): This is the ultimate line in the sand for November. It represents the structural higher-low pivot of the current recovery.
22,239.40: Macro capitulation support (the October low origin).
3. SCENARIO FORECASTING
Scenario A: Bullish Breakout (Low to Moderate Probability)
For the bulls to regain total control, the index must sustain momentum above the immediate 23,125 hurdle and forcefully penetrate the 23,280–23,350 GAP. Gaps are rarely cleared effortlessly. If Nifty prints a strong daily candle closing above 23,350, it invalidates the bearish thesis and triggers a structural Change of Character (CHoCH), activating upper targets at 23,488 and 23,606.
Scenario B: Channel Rejection & Gap Fade (High Probability)
Price pushes slightly higher into the 23,125–23,280 region but experiences momentum exhaustion as it hits the lower bound of the Gap (or the upper white trendline). This triggers a reversal, breaking the lower ascending trendline and pulling the index down to test the 22,560.10 Make/Break level.
Scenario C: Structural Breakdown (Bearish Resumption)
If the index fails to hold the ascending channel and subsequently breaks and closes below the 22,560.10 dashed line, the November recovery is officially invalidated. This would confirm a lower-high structure on the macro timeframe, paving the way for a liquidity sweep down to 22,239.40 and potentially lower.
Current Price: 23,053.10
1. MARKET STRUCTURE & PRICE ACTION OVERVIEW
Following a sharp capitulation phase in early-to-mid October that drove the index down toward the 22,200 region, the Nifty 50 has transitioned into a short-term corrective recovery phase.
This recovery is currently defined by a precise Ascending Channel (marked by the solid white rising trendlines). The price action is creating a sequence of higher highs and higher lows within this boundary. However, the angle of ascent is relatively steep compared to the preceding drop, suggesting this may be a bear-flag/corrective bounce rather than a confirmed macro trend reversal. The index is currently compressing near the upper boundary of this channel, facing immediate resistance.
2. PRECISION SUPPORT & RESISTANCE (THE ANNOTATED LEVELS)
The chart clearly maps out the algorithmic and structural pivot levels for the month.
Overhead Resistance (Supply):
23,125.75 – 23,129.05: Immediate local resistance. A rejection here (indicated by the red down arrow) keeps price suppressed within the lower half of the channel.
23,280.00 – 23,350.00 (THE GAP): This is the most critical overhead supply zone on the chart. Unfilled downside gaps act as strong institutional resistance magnets. This zone must be treated as a high-probability rejection area on its first test.
23,488.85 & 23,606.00: Macro breakout targets. A confirmed daily close above the Gap zone opens the door to 23,606 (highlighted by the green continuation arrow).
Downside Support (Demand):
2,980.40: Immediate minor support (recent local pivot).
22,795.05: Intermediate structural support. A break below this invalidates the current ascending channel's lower boundary.
22,560.10 (THE MAKE / BREAK LEVEL): This is the ultimate line in the sand for November. It represents the structural higher-low pivot of the current recovery.
22,239.40: Macro capitulation support (the October low origin).
3. SCENARIO FORECASTING
Scenario A: Bullish Breakout (Low to Moderate Probability)
For the bulls to regain total control, the index must sustain momentum above the immediate 23,125 hurdle and forcefully penetrate the 23,280–23,350 GAP. Gaps are rarely cleared effortlessly. If Nifty prints a strong daily candle closing above 23,350, it invalidates the bearish thesis and triggers a structural Change of Character (CHoCH), activating upper targets at 23,488 and 23,606.
Scenario B: Channel Rejection & Gap Fade (High Probability)
Price pushes slightly higher into the 23,125–23,280 region but experiences momentum exhaustion as it hits the lower bound of the Gap (or the upper white trendline). This triggers a reversal, breaking the lower ascending trendline and pulling the index down to test the 22,560.10 Make/Break level.
Scenario C: Structural Breakdown (Bearish Resumption)
If the index fails to hold the ascending channel and subsequently breaks and closes below the 22,560.10 dashed line, the November recovery is officially invalidated. This would confirm a lower-high structure on the macro timeframe, paving the way for a liquidity sweep down to 22,239.40 and potentially lower.

Related publications
Disclaimer
The information and publications are not meant to be, and do not constitute, financial, investment, trading, or other types of advice or recommendations supplied or endorsed by TradingView. Read more in the Terms of Use.
Related publications
Disclaimer
The information and publications are not meant to be, and do not constitute, financial, investment, trading, or other types of advice or recommendations supplied or endorsed by TradingView. Read more in the Terms of Use.