
🚀 Educational Price Action Guide 📚
Hello Traders! 🙋♂️ Welcome back to our daily technical analysis and professional execution framework. Today we are breaking down the structural market geometry of NIFTY 50 for the upcoming session on 11-Jun-2026.
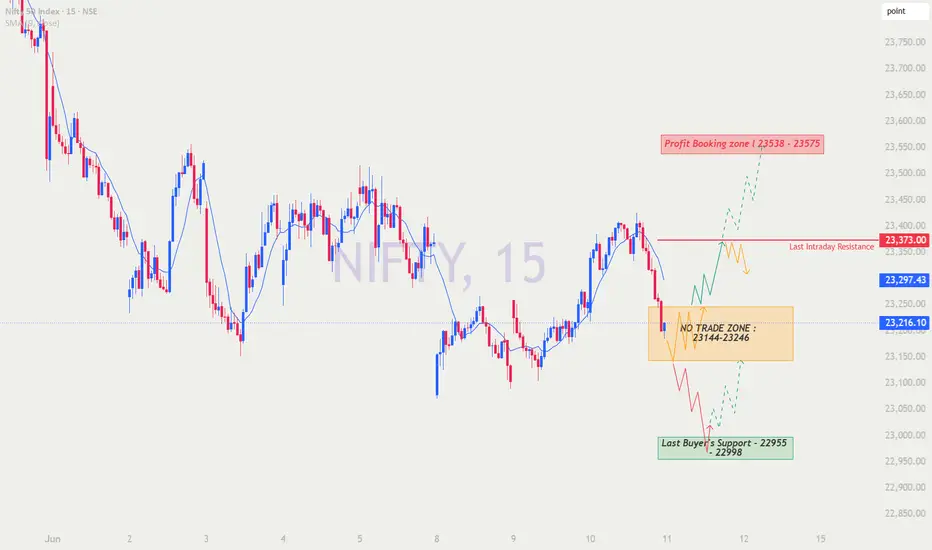
Referring directly to the 15-minute timeframe chart provided in image_82ca97.png, the index closed the previous session at 23,216.10, positioning itself exactly in the middle of a high-risk consolidation trap. The 9-SMA is acting as dynamic overhead pressure at 23,297.43.
Let's decode the price action and map out objective, level-to-level strategies for all three opening scenarios. 🧠📈
🟢 Scenario 1: Gap Up Opening (100+ Points)
If global cues drive a 100+ point gap up, Nifty will open around 23,316, completely clearing our No Trade Zone and slicing just above the 9-SMA line. This places the index right below the Last Intraday Resistance at 23,373.00.
Educational Logic & Plan of Action:
🔹 Avoid the Immediate Trap: A gap up of this size leaves overnight call buyers with quick profits, often leading to a morning sell-off. Do not chase the initial green candles into the 23,373.00 resistance.
🔹 The Retest & Continuation (Solid Green Path): Wait for a corrective pullback to test the top of our breakout box at 23,246. If the price finds support here and prints a bullish rejection wick or a morning star pattern, you can plan a long trade aiming for 23,373.00.
🔹 Major Breakout (Dotted Green Path): If bulls aggressively clear the 23,373.00 resistance with heavy volume, it opens the structural highway directly toward the ultimate Profit Booking zone at 23,538 - 23,575.
🔹 Rejection Watch (Orange Path): Be very careful near 23,373.00. If the market forms a double top or long upper wicks here, it signals institutional selling, dragging the price back into the chop zone.
🟡 Scenario 2: Flat Opening (Near 23,216)
A flat opening means Nifty starts the day right around yesterday's close, burying it deep inside our predefined NO TRADE ZONE: 23,144 - 23,246.
Educational Logic & Plan of Action:
🔹 The Theta Quicksand (Orange Zigzag Path): This orange box is a strict no-fly zone for option buyers. When the market opens flat here, buyers and sellers are deadlocked. The price will aggressively chop up and down between 23,144 and 23,246, destroying option premiums through time decay.
🔹 Patience is Your Edge: Keep your hands off the terminal. Let the retail traders fight in the middle while you wait for a structural boundary to break.
🔹 The Breakout Execution: A 15-minute candle close above 23,246 hands control to the bulls, validating the green path toward 23,373.00.
🔹 The Breakdown Execution: A 15-minute candle close below 23,144 hands control to the bears, triggering the red path toward our lower demand zones.
🔴 Scenario 3: Gap Down Opening (100+ Points)
A heavy 100+ point gap down will dump the opening price near 23,116, slicing straight through the bottom of our No Trade Zone and violating immediate support.
Educational Logic & Plan of Action:
🔹 The Bearish Flush (Solid Red Path): Opening below 23,144 immediately shifts the intraday trend to bearish. If the index attempts to recover in the morning but treats 23,144 as a hard resistance ceiling (sell-on-rising), it confirms heavy supply.
🔹 Riding the Slide: You can initiate a short/Put position targeting a deep structural slide down into the Last Buyer's Support block at 22,955 - 22,998.
🔹 The Institutional Reversal (Dotted Green Path from Bottom): Do not short blindly into the green box! The 22,955 - 22,998 zone is a major historical accumulation floor. Watch price action closely here. If you see a failure to make lower lows, accompanied by a sharp W-pattern or heavy buying volume, this is a prime institutional trap. Plan a high risk-to-reward long swing trade targeting a fierce short-covering rally back up.
🛡️ Risk Management Protocol for Options Trading
Profitable trading is 20% strategy and 80% risk management. Protect your capital with these strict rules today:
🔹 Respect the Box: If the index is trapped between 23,144 and 23,246, option buyers must stay out. Theta decay will drain your account even if the market doesn't move against your direction.
🔹 Index-Anchored Stop Loss: Never place a stop loss based on volatile option premium charts. Always calculate and trigger your exits based purely on the Nifty spot index chart levels.
🔹 Capital Exposure Limits: Limit your risk to 1% - 2% of your total trading capital per setup. If a gap down catches you on the wrong side, a small position size prevents account blowouts.
🔹 Strike Selection: Strictly trade At-The-Money (ATM) or slight In-The-Money (ITM) options. Deep Out-Of-The-Money (OTM) strikes are statistical traps designed to expire worthless.
📝 Summary & Conclusion
To summarize today's operational roadmap: The 23,144 - 23,246 box is the ultimate referee. Entering trades inside this zone is a gamble against time decay. A decisive breakout above 23,246 allows bulls to target the 23,373.00 wall, and eventually the 23,538 - 23,575 Profit Booking zone. On the flip side, a structural breakdown below 23,144 opens a trapdoor for the bears to flush the market into the Last Buyer's Support at 22,955 - 22,998, where we must actively watch for a major swing reversal. Wait for your setups, let the 15-minute candles confirm the story, and trade with absolute discipline! 🎯🛡️
Disclaimer: I am not a sebi registered analyst. This detailed technical roadmap, chart breakdown, and price action log are curated strictly for educational illustration and mock simulation practice. Please perform your own exhaustive due diligence and consult your certified financial planner before risking real currency in the live markets.
Hello Traders! 🙋♂️ Welcome back to our daily technical analysis and professional execution framework. Today we are breaking down the structural market geometry of NIFTY 50 for the upcoming session on 11-Jun-2026.
Referring directly to the 15-minute timeframe chart provided in image_82ca97.png, the index closed the previous session at 23,216.10, positioning itself exactly in the middle of a high-risk consolidation trap. The 9-SMA is acting as dynamic overhead pressure at 23,297.43.
Let's decode the price action and map out objective, level-to-level strategies for all three opening scenarios. 🧠📈
🟢 Scenario 1: Gap Up Opening (100+ Points)
If global cues drive a 100+ point gap up, Nifty will open around 23,316, completely clearing our No Trade Zone and slicing just above the 9-SMA line. This places the index right below the Last Intraday Resistance at 23,373.00.
Educational Logic & Plan of Action:
🔹 Avoid the Immediate Trap: A gap up of this size leaves overnight call buyers with quick profits, often leading to a morning sell-off. Do not chase the initial green candles into the 23,373.00 resistance.
🔹 The Retest & Continuation (Solid Green Path): Wait for a corrective pullback to test the top of our breakout box at 23,246. If the price finds support here and prints a bullish rejection wick or a morning star pattern, you can plan a long trade aiming for 23,373.00.
🔹 Major Breakout (Dotted Green Path): If bulls aggressively clear the 23,373.00 resistance with heavy volume, it opens the structural highway directly toward the ultimate Profit Booking zone at 23,538 - 23,575.
🔹 Rejection Watch (Orange Path): Be very careful near 23,373.00. If the market forms a double top or long upper wicks here, it signals institutional selling, dragging the price back into the chop zone.
🟡 Scenario 2: Flat Opening (Near 23,216)
A flat opening means Nifty starts the day right around yesterday's close, burying it deep inside our predefined NO TRADE ZONE: 23,144 - 23,246.
Educational Logic & Plan of Action:
🔹 The Theta Quicksand (Orange Zigzag Path): This orange box is a strict no-fly zone for option buyers. When the market opens flat here, buyers and sellers are deadlocked. The price will aggressively chop up and down between 23,144 and 23,246, destroying option premiums through time decay.
🔹 Patience is Your Edge: Keep your hands off the terminal. Let the retail traders fight in the middle while you wait for a structural boundary to break.
🔹 The Breakout Execution: A 15-minute candle close above 23,246 hands control to the bulls, validating the green path toward 23,373.00.
🔹 The Breakdown Execution: A 15-minute candle close below 23,144 hands control to the bears, triggering the red path toward our lower demand zones.
🔴 Scenario 3: Gap Down Opening (100+ Points)
A heavy 100+ point gap down will dump the opening price near 23,116, slicing straight through the bottom of our No Trade Zone and violating immediate support.
Educational Logic & Plan of Action:
🔹 The Bearish Flush (Solid Red Path): Opening below 23,144 immediately shifts the intraday trend to bearish. If the index attempts to recover in the morning but treats 23,144 as a hard resistance ceiling (sell-on-rising), it confirms heavy supply.
🔹 Riding the Slide: You can initiate a short/Put position targeting a deep structural slide down into the Last Buyer's Support block at 22,955 - 22,998.
🔹 The Institutional Reversal (Dotted Green Path from Bottom): Do not short blindly into the green box! The 22,955 - 22,998 zone is a major historical accumulation floor. Watch price action closely here. If you see a failure to make lower lows, accompanied by a sharp W-pattern or heavy buying volume, this is a prime institutional trap. Plan a high risk-to-reward long swing trade targeting a fierce short-covering rally back up.
🛡️ Risk Management Protocol for Options Trading
Profitable trading is 20% strategy and 80% risk management. Protect your capital with these strict rules today:
🔹 Respect the Box: If the index is trapped between 23,144 and 23,246, option buyers must stay out. Theta decay will drain your account even if the market doesn't move against your direction.
🔹 Index-Anchored Stop Loss: Never place a stop loss based on volatile option premium charts. Always calculate and trigger your exits based purely on the Nifty spot index chart levels.
🔹 Capital Exposure Limits: Limit your risk to 1% - 2% of your total trading capital per setup. If a gap down catches you on the wrong side, a small position size prevents account blowouts.
🔹 Strike Selection: Strictly trade At-The-Money (ATM) or slight In-The-Money (ITM) options. Deep Out-Of-The-Money (OTM) strikes are statistical traps designed to expire worthless.
📝 Summary & Conclusion
To summarize today's operational roadmap: The 23,144 - 23,246 box is the ultimate referee. Entering trades inside this zone is a gamble against time decay. A decisive breakout above 23,246 allows bulls to target the 23,373.00 wall, and eventually the 23,538 - 23,575 Profit Booking zone. On the flip side, a structural breakdown below 23,144 opens a trapdoor for the bears to flush the market into the Last Buyer's Support at 22,955 - 22,998, where we must actively watch for a major swing reversal. Wait for your setups, let the 15-minute candles confirm the story, and trade with absolute discipline! 🎯🛡️
Disclaimer: I am not a sebi registered analyst. This detailed technical roadmap, chart breakdown, and price action log are curated strictly for educational illustration and mock simulation practice. Please perform your own exhaustive due diligence and consult your certified financial planner before risking real currency in the live markets.

Related publications
Disclaimer
The information and publications are not meant to be, and do not constitute, financial, investment, trading, or other types of advice or recommendations supplied or endorsed by TradingView. Read more in the Terms of Use.
Related publications
Disclaimer
The information and publications are not meant to be, and do not constitute, financial, investment, trading, or other types of advice or recommendations supplied or endorsed by TradingView. Read more in the Terms of Use.