
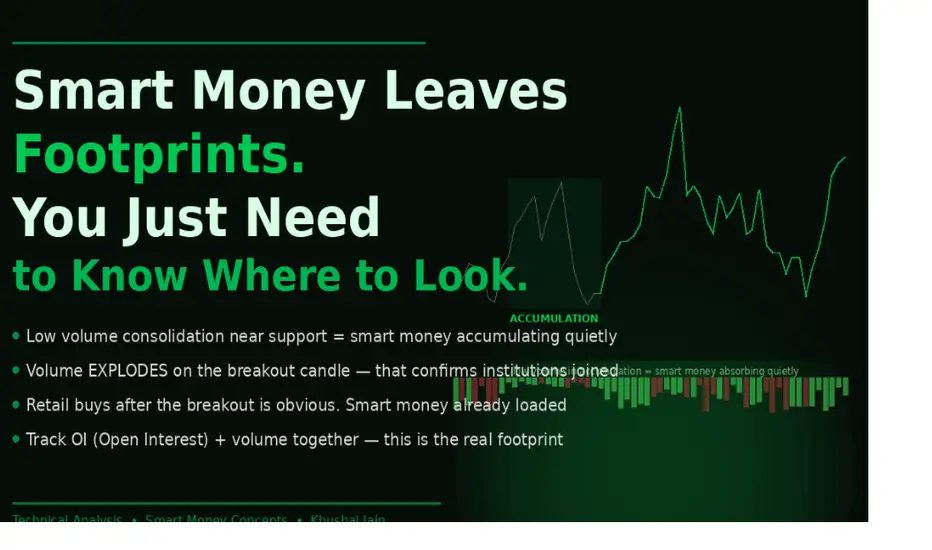
Smart Money Leaves Footprints. You Just Need to Know Where to Look.
Before every major rally, the same pattern appears. Quiet accumulation. Low volume. Boring price action. And then — the explosion.
Here is a question: if you were managing ₹10,000 crore and wanted to buy a stock, how would you do it? You could not buy ₹10,000 crore in one day — you would move the price against yourself so severely that you would end up paying far more than you intended.
Instead, you would buy quietly. Small amounts. Over weeks or months. Every time price dips slightly, you buy a little more. Every time retail traders panic and sell — you absorb their selling. This process leaves a very specific signature on a chart. And once you know what it looks like, you will see it everywhere.
The Accumulation Footprint — How to Identify It
Sign 1 — Tight price range near support:
Price stops making new lows. It consolidates in a narrow band. The range becomes tighter over time as selling pressure is absorbed.
Sign 2 — Volume dries up on down days, picks up on up days:
This is the most telling sign. When institutional buyers are present, selling into their bids dries up quickly (little volume on red candles) while any buying moves price easily (volume on green candles).
Sign 3 — Multiple tests of support that hold:
Price keeps being pushed back up from the same level. It is not bouncing on its own — it is being bought each time it dips. This is unfilled institutional order flow.
Sign 4 — The Spring:
A brief, sharp move below support on light volume — designed to trigger retail stop losses — immediately followed by a strong recovery close above support. This is smart money shaking out weak holders before the rally begins.
Sign 5 — The Breakout Volume Signature:
When accumulation is complete, price breaks above the range on dramatically higher volume — often 2–3x the recent average. This is institutional buying accelerating, not retail FOMO. The volume confirms genuine conviction.
Tracking Smart Money with Open Interest
In futures and options markets, Open Interest (OI) tells you how many contracts are outstanding. Used with price and volume, it reveals institutional positioning:
Check NSE's OI data every day for your key trading instruments. The story it tells is more honest than any indicator.
The Retail Trader's Advantage
Large institutional money is slow. They need weeks to build positions. This actually gives patient, observant retail traders time to identify the accumulation and position alongside smart money — before the move begins.
Follow for more ideas that teach you to read the market like the professionals who move it.
Before every major rally, the same pattern appears. Quiet accumulation. Low volume. Boring price action. And then — the explosion.
Here is a question: if you were managing ₹10,000 crore and wanted to buy a stock, how would you do it? You could not buy ₹10,000 crore in one day — you would move the price against yourself so severely that you would end up paying far more than you intended.
Instead, you would buy quietly. Small amounts. Over weeks or months. Every time price dips slightly, you buy a little more. Every time retail traders panic and sell — you absorb their selling. This process leaves a very specific signature on a chart. And once you know what it looks like, you will see it everywhere.
The Accumulation Footprint — How to Identify It
Sign 1 — Tight price range near support:
Price stops making new lows. It consolidates in a narrow band. The range becomes tighter over time as selling pressure is absorbed.
Sign 2 — Volume dries up on down days, picks up on up days:
This is the most telling sign. When institutional buyers are present, selling into their bids dries up quickly (little volume on red candles) while any buying moves price easily (volume on green candles).
Sign 3 — Multiple tests of support that hold:
Price keeps being pushed back up from the same level. It is not bouncing on its own — it is being bought each time it dips. This is unfilled institutional order flow.
Sign 4 — The Spring:
A brief, sharp move below support on light volume — designed to trigger retail stop losses — immediately followed by a strong recovery close above support. This is smart money shaking out weak holders before the rally begins.
Sign 5 — The Breakout Volume Signature:
When accumulation is complete, price breaks above the range on dramatically higher volume — often 2–3x the recent average. This is institutional buying accelerating, not retail FOMO. The volume confirms genuine conviction.
Tracking Smart Money with Open Interest
In futures and options markets, Open Interest (OI) tells you how many contracts are outstanding. Used with price and volume, it reveals institutional positioning:
- Price rising + OI rising + volume rising = Fresh institutional longs being built. Strong bullish signal.
- Price rising + OI falling = Short covering (bears exiting). Rally may be temporary.
- Price falling + OI rising + volume rising = Fresh institutional shorts being built. Strong bearish signal.
- Price falling + OI falling = Long liquidation (weak bulls exiting). Fall may be near its end.
Check NSE's OI data every day for your key trading instruments. The story it tells is more honest than any indicator.
The Retail Trader's Advantage
Large institutional money is slow. They need weeks to build positions. This actually gives patient, observant retail traders time to identify the accumulation and position alongside smart money — before the move begins.
Follow for more ideas that teach you to read the market like the professionals who move it.
Note
Did you know? Over 85% of daily trading volume in the global markets is generated by institutional algorithms and HFTs (High-Frequency Trading). Retail traders are often just providing the liquidity that these giants need to exit their positions.The Lesson: Stop trying to fight the ocean. Learn to swim with the whales.
Note
If this logic helped you understand the market better, hit the Boost button. It takes 1 second but helps me create more free institutional content for you.
Disclaimer
The information and publications are not meant to be, and do not constitute, financial, investment, trading, or other types of advice or recommendations supplied or endorsed by TradingView. Read more in the Terms of Use.
Disclaimer
The information and publications are not meant to be, and do not constitute, financial, investment, trading, or other types of advice or recommendations supplied or endorsed by TradingView. Read more in the Terms of Use.