
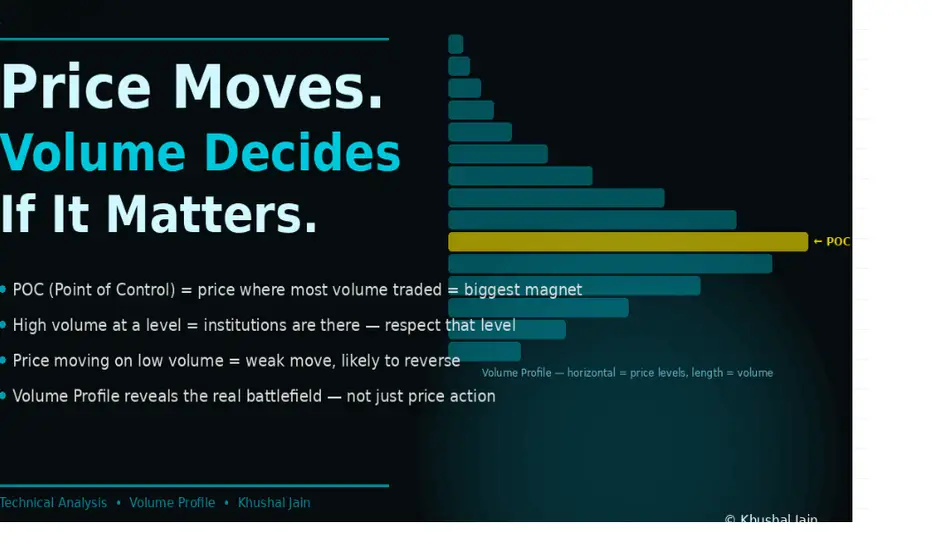
Volume Profile: The Map of Where Institutional Money Actually Lives on Your Chart.
Price shows you where the market went. Volume profile shows you where the market wanted to go — and where it will return.
Most traders look at a chart and see a line going up and down. Professional traders look at the same chart and see a three-dimensional battlefield — they see not just price but how much was traded at every single price level.
That is Volume Profile. And it reveals one of the most powerful concepts in all of technical analysis.
What Volume Profile Actually Shows
Standard volume (the bars at the bottom of your chart) shows how much was traded in each time period — 5 minutes, 1 hour, 1 day.
Volume Profile shows something different: how much was traded at each price level — horizontally, not based on time. The result is a histogram on the side of your chart. Tall bars = lots of trading at that price. Short bars = little trading.
The Point of Control (POC): The Most Important Level You Have Never Drawn
The POC is the price level where the most volume was traded over a given period.
It is the most important level on the chart because:
Markets almost always return to the POC before making their next significant move. This "return to fair value" is one of the most reliable phenomena in all of trading.
Practical rule: If price is 5–8% above the POC and starts losing momentum, the POC is your first downside target. If price drops 5–8% below the POC and starts finding support, the POC is your first upside target.
High Volume Nodes and Low Volume Nodes
High Volume Node (HVN):
A price level where massive volume was traded. Price tends to slow down and consolidate near HVNs because so many orders were placed there — many are still pending. HVNs act as strong support or resistance.
Low Volume Node (LVN):
A price level where very little volume was traded. Price tends to move through LVNs quickly because there are few orders there to slow it down.
This is the hidden reason why prices sometimes seem to "skip" over certain levels — they are passing through low-volume zones where there is nothing to stop them. And why they sometimes refuse to move for days at a specific level — they are stuck in a high-volume node.
Value Area: Where 70% of Volume Lives
The Value Area is the price range that contains 70% of all volume traded in a session or period
Follow for more technical analysis ideas that go beyond what most courses ever teach. Every like tells me this is helping real traders
Price shows you where the market went. Volume profile shows you where the market wanted to go — and where it will return.
Most traders look at a chart and see a line going up and down. Professional traders look at the same chart and see a three-dimensional battlefield — they see not just price but how much was traded at every single price level.
That is Volume Profile. And it reveals one of the most powerful concepts in all of technical analysis.
What Volume Profile Actually Shows
Standard volume (the bars at the bottom of your chart) shows how much was traded in each time period — 5 minutes, 1 hour, 1 day.
Volume Profile shows something different: how much was traded at each price level — horizontally, not based on time. The result is a histogram on the side of your chart. Tall bars = lots of trading at that price. Short bars = little trading.
The Point of Control (POC): The Most Important Level You Have Never Drawn
The POC is the price level where the most volume was traded over a given period.
It is the most important level on the chart because:
- Institutions placed their largest orders there
- The market found its "fairest" price at that level
- Price has a powerful gravitational pull toward the POC — like a magnet
Markets almost always return to the POC before making their next significant move. This "return to fair value" is one of the most reliable phenomena in all of trading.
Practical rule: If price is 5–8% above the POC and starts losing momentum, the POC is your first downside target. If price drops 5–8% below the POC and starts finding support, the POC is your first upside target.
High Volume Nodes and Low Volume Nodes
High Volume Node (HVN):
A price level where massive volume was traded. Price tends to slow down and consolidate near HVNs because so many orders were placed there — many are still pending. HVNs act as strong support or resistance.
Low Volume Node (LVN):
A price level where very little volume was traded. Price tends to move through LVNs quickly because there are few orders there to slow it down.
This is the hidden reason why prices sometimes seem to "skip" over certain levels — they are passing through low-volume zones where there is nothing to stop them. And why they sometimes refuse to move for days at a specific level — they are stuck in a high-volume node.
Value Area: Where 70% of Volume Lives
The Value Area is the price range that contains 70% of all volume traded in a session or period
- VAH (Value Area High) — upper boundary
- VAL (Value Area Low) — lower boundary
- Price returning inside the Value Area after being outside it → 80% probability of reaching the opposite boundary
- Price opening outside the Value Area and failing to enter → trend continuation in the direction away from Value Area
- These rules work because institutions are defending their average entry prices — which are inside the Value Area
Follow for more technical analysis ideas that go beyond what most courses ever teach. Every like tells me this is helping real traders
Note
Most retail traders are busy staring at the 'what' (Price). Professionals are obsessed with the 'where' (Value). This Volume Profile setup isn't just a strategy; it’s a peek into the institutional ledger. If you’re tired of being liquidity, start trading where the volume lives. Boost if this changed your perspective
Disclaimer
The information and publications are not meant to be, and do not constitute, financial, investment, trading, or other types of advice or recommendations supplied or endorsed by TradingView. Read more in the Terms of Use.
Disclaimer
The information and publications are not meant to be, and do not constitute, financial, investment, trading, or other types of advice or recommendations supplied or endorsed by TradingView. Read more in the Terms of Use.