
Levels, Price Action & Logic 🧠📊
Hello Traders! 👋 Welcome to today’s educational pre-market analysis.
Trading isn't about predicting the market; it's about reacting to it with a well-defined plan. Based on the 15-minute timeframe chart provided, we have plotted crucial supply and demand zones.
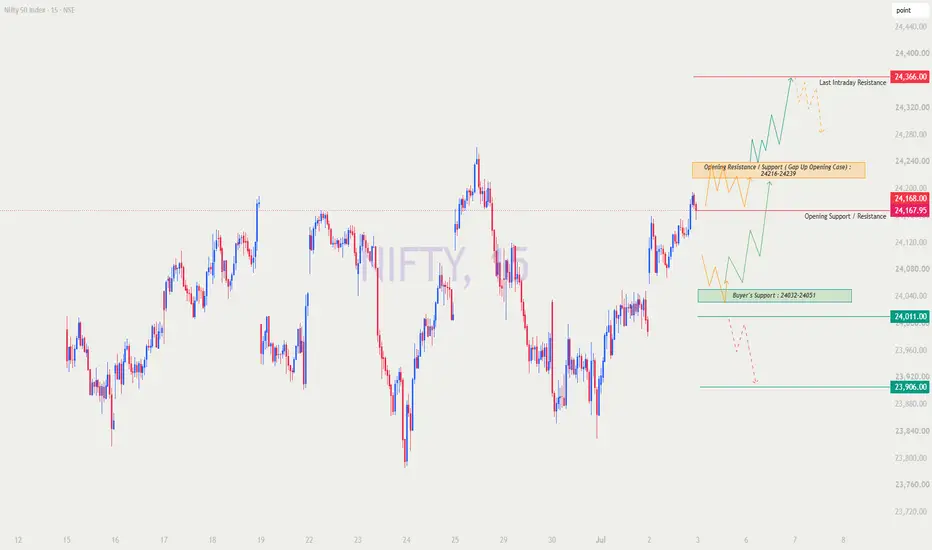
Before we dive into the scenarios, let's decode the "Color Language" of today's chart. Understanding this is vital for your trade execution:
🔸 Orange Lines (Zigzag): Sideways / No-Trade Zone. The market is trapping both buyers and sellers here. Sit on your hands!
🟢 Green Lines: High Probability Bullish / Long Setup. Look for buying opportunities when price follows these paths.
🔴 Red Lines / Dashed Lines: Bearish / Short Setup or Probable Trend. Dashed lines mean "Maybe or Maybe Not" – tread with caution and reduce position size.
Here is the detailed action plan for all three opening scenarios for 03-Jul-2026.
Scenario 1: Flat Opening (Between 24,150 - 24,180) ⚖️
Educational Logic: A flat opening means the overnight sentiment is neutral. The market will look to the first 30 minutes of price action to decide its intraday trend. The closing price of 24,167.95 acts as an immediate pivot.
🔹 If Price Sustains Above 24,168: Look at the solid green line on the chart. If the price forms higher highs on the 5-min chart above the closing line, we will initiate a Long position. Our first target will be the 24,216 - 24,239 zone.
🔹 The Trap Zone: If the price struggles to cross 24,168 and starts drifting lower, it will enter the orange zigzag zone. Do not trade here. The price will likely chop around aimlessly between 24,168 and 24,051. Save your capital and wait for a clear level test.
🔹 Actionable Plan: Go long above 24,180 with a strict stop loss below 24,140. Avoid trading if the market drifts downward slowly without momentum.
Scenario 2: Gap Up Opening (100+ Points | Opening near 24,267+) 🚀
Educational Logic: A massive 100+ point gap up implies aggressive overnight buying. However, markets rarely go straight up after a huge gap. Profit booking from BTST (Buy Today, Sell Tomorrow) traders is highly likely, which causes a morning dip.
🔹 The Retracement Trade: If we open near 24,270+, wait for the price to cool off and drop into the "Opening Resistance / Support Box" (24,216 - 24,239).
🔹 Watch the Orange Lines: Notice the orange zigzag in this box? This indicates extreme volatility and a tug-of-war between buyers and sellers. Do not enter immediately on the dip. Let the price consolidate in this box.
🔹 Actionable Plan: Wait for a solid bullish reversal pattern (like an engulfing candle or a hammer) at the bottom of the 24,216 zone. Once confirmed, go Long (following the upper green arrow) targeting the Last Intraday Resistance at 24,366.00.
🔹 Caution at Target: Notice the dashed orange line near 24,366? This means the trend may exhaust here. Book 80-100% of your profits at this level!
Scenario 3: Gap Down Opening (100+ Points | Opening near 24,067-) 🩸
Educational Logic: A gap down creates panic among retail buyers, but smart money often looks at gap downs into major support as a discount buying opportunity. Never short blindly into a gap down!
🔹 The Golden Buying Zone: A 100-point gap down brings us directly to the "Buyer's Support" green box (24,032 - 24,051). Look at the chart—there is a solid green line bouncing strongly from this exact zone!
🔹 Actionable Plan (Long): If the market opens near 24,050, wait for the first 5 or 15-minute candle to close. If it shows buying rejection (long lower wick), take a Long position with a stop loss just below the green box (24,011). Target the gap-filling area near 24,168. This offers the best Risk-to-Reward ratio of the day!
🔹 The Bearish Breakdown: What if the selling pressure is brutal? Look at the dashed red lines. If the price breaks and closes a 15-minute candle below 24,011.00 with high volumes, the support is broken. You can initiate a cautious Short trade targeting 23,906.00. (Why cautious? Because it's a dashed line—meaning the trend may or may not sustain. Keep position size at 50%).
🛡️ Pro-Tips for Options Trading & Risk Management 🛡️
Options trading is highly leveraged. Without risk management, even the best chart analysis will fail. Keep these rules printed on your desk:
🔸 Respect Theta (Time Decay): If the market enters the orange "No Trade / Sideways" zones, Option Buyers will lose money even if the market doesn't move against them. Theta will eat your premium. Cash is a position!
🔸 Strike Price Selection: Always trade In-The-Money (ITM) or At-The-Money (ATM) options. Avoid Out-Of-The-Money (OTM) lottery tickets—they have a very low probability of success.
🔸 Stop Loss on Spot, Not Premium: Place your stop loss based on the Nifty Spot chart levels (e.g., SL below 24,011), not on the option premium chart. Option premiums fluctuate wildly; spot charts show the true market structure.
🔸 Position Sizing on Dashed Lines: When trading the dashed lines (probable trends), strictly cut your standard lot size in half. Protect your capital during lower-probability setups.
🔸 Max Loss Per Day: Define your maximum daily loss limit before the market opens. If you hit it, close your terminal. Revenge trading is the fastest way to blow an account.
📝 Summary & Conclusion
The market structure currently shows a healthy battle between buyers at lower levels and sellers near the all-time high zones.
Ultimate Line in the Sand: The 24,032 - 24,051 zone is the Make-or-Break level for buyers. As long as we are above it, dips are meant to be bought.
Upside Hurdle: 24,366 is the key resistance. We need significant momentum to cross it.
Patience pays: The space between 24,051 and 24,168 is highly choppy. Wait for the market to come to your designated levels. Trade the plan, don't trade your emotions!
🚨 DISCLAIMER: I am NOT a SEBI Registered Analyst or Financial Advisor. This post is strictly for educational purposes and chart reading practice. Financial markets involve a high degree of risk. Please consult with your personal financial advisor and do your own research before executing any real-money trades. I am not responsible for any profits or losses incurred based on this analysis. 🚨
Hello Traders! 👋 Welcome to today’s educational pre-market analysis.
Trading isn't about predicting the market; it's about reacting to it with a well-defined plan. Based on the 15-minute timeframe chart provided, we have plotted crucial supply and demand zones.
Before we dive into the scenarios, let's decode the "Color Language" of today's chart. Understanding this is vital for your trade execution:
🔸 Orange Lines (Zigzag): Sideways / No-Trade Zone. The market is trapping both buyers and sellers here. Sit on your hands!
🟢 Green Lines: High Probability Bullish / Long Setup. Look for buying opportunities when price follows these paths.
🔴 Red Lines / Dashed Lines: Bearish / Short Setup or Probable Trend. Dashed lines mean "Maybe or Maybe Not" – tread with caution and reduce position size.
Here is the detailed action plan for all three opening scenarios for 03-Jul-2026.
Scenario 1: Flat Opening (Between 24,150 - 24,180) ⚖️
Educational Logic: A flat opening means the overnight sentiment is neutral. The market will look to the first 30 minutes of price action to decide its intraday trend. The closing price of 24,167.95 acts as an immediate pivot.
🔹 If Price Sustains Above 24,168: Look at the solid green line on the chart. If the price forms higher highs on the 5-min chart above the closing line, we will initiate a Long position. Our first target will be the 24,216 - 24,239 zone.
🔹 The Trap Zone: If the price struggles to cross 24,168 and starts drifting lower, it will enter the orange zigzag zone. Do not trade here. The price will likely chop around aimlessly between 24,168 and 24,051. Save your capital and wait for a clear level test.
🔹 Actionable Plan: Go long above 24,180 with a strict stop loss below 24,140. Avoid trading if the market drifts downward slowly without momentum.
Scenario 2: Gap Up Opening (100+ Points | Opening near 24,267+) 🚀
Educational Logic: A massive 100+ point gap up implies aggressive overnight buying. However, markets rarely go straight up after a huge gap. Profit booking from BTST (Buy Today, Sell Tomorrow) traders is highly likely, which causes a morning dip.
🔹 The Retracement Trade: If we open near 24,270+, wait for the price to cool off and drop into the "Opening Resistance / Support Box" (24,216 - 24,239).
🔹 Watch the Orange Lines: Notice the orange zigzag in this box? This indicates extreme volatility and a tug-of-war between buyers and sellers. Do not enter immediately on the dip. Let the price consolidate in this box.
🔹 Actionable Plan: Wait for a solid bullish reversal pattern (like an engulfing candle or a hammer) at the bottom of the 24,216 zone. Once confirmed, go Long (following the upper green arrow) targeting the Last Intraday Resistance at 24,366.00.
🔹 Caution at Target: Notice the dashed orange line near 24,366? This means the trend may exhaust here. Book 80-100% of your profits at this level!
Scenario 3: Gap Down Opening (100+ Points | Opening near 24,067-) 🩸
Educational Logic: A gap down creates panic among retail buyers, but smart money often looks at gap downs into major support as a discount buying opportunity. Never short blindly into a gap down!
🔹 The Golden Buying Zone: A 100-point gap down brings us directly to the "Buyer's Support" green box (24,032 - 24,051). Look at the chart—there is a solid green line bouncing strongly from this exact zone!
🔹 Actionable Plan (Long): If the market opens near 24,050, wait for the first 5 or 15-minute candle to close. If it shows buying rejection (long lower wick), take a Long position with a stop loss just below the green box (24,011). Target the gap-filling area near 24,168. This offers the best Risk-to-Reward ratio of the day!
🔹 The Bearish Breakdown: What if the selling pressure is brutal? Look at the dashed red lines. If the price breaks and closes a 15-minute candle below 24,011.00 with high volumes, the support is broken. You can initiate a cautious Short trade targeting 23,906.00. (Why cautious? Because it's a dashed line—meaning the trend may or may not sustain. Keep position size at 50%).
🛡️ Pro-Tips for Options Trading & Risk Management 🛡️
Options trading is highly leveraged. Without risk management, even the best chart analysis will fail. Keep these rules printed on your desk:
🔸 Respect Theta (Time Decay): If the market enters the orange "No Trade / Sideways" zones, Option Buyers will lose money even if the market doesn't move against them. Theta will eat your premium. Cash is a position!
🔸 Strike Price Selection: Always trade In-The-Money (ITM) or At-The-Money (ATM) options. Avoid Out-Of-The-Money (OTM) lottery tickets—they have a very low probability of success.
🔸 Stop Loss on Spot, Not Premium: Place your stop loss based on the Nifty Spot chart levels (e.g., SL below 24,011), not on the option premium chart. Option premiums fluctuate wildly; spot charts show the true market structure.
🔸 Position Sizing on Dashed Lines: When trading the dashed lines (probable trends), strictly cut your standard lot size in half. Protect your capital during lower-probability setups.
🔸 Max Loss Per Day: Define your maximum daily loss limit before the market opens. If you hit it, close your terminal. Revenge trading is the fastest way to blow an account.
📝 Summary & Conclusion
The market structure currently shows a healthy battle between buyers at lower levels and sellers near the all-time high zones.
Ultimate Line in the Sand: The 24,032 - 24,051 zone is the Make-or-Break level for buyers. As long as we are above it, dips are meant to be bought.
Upside Hurdle: 24,366 is the key resistance. We need significant momentum to cross it.
Patience pays: The space between 24,051 and 24,168 is highly choppy. Wait for the market to come to your designated levels. Trade the plan, don't trade your emotions!
🚨 DISCLAIMER: I am NOT a SEBI Registered Analyst or Financial Advisor. This post is strictly for educational purposes and chart reading practice. Financial markets involve a high degree of risk. Please consult with your personal financial advisor and do your own research before executing any real-money trades. I am not responsible for any profits or losses incurred based on this analysis. 🚨

Related publications
Disclaimer
The information and publications are not meant to be, and do not constitute, financial, investment, trading, or other types of advice or recommendations supplied or endorsed by TradingView. Read more in the Terms of Use.
Related publications
Disclaimer
The information and publications are not meant to be, and do not constitute, financial, investment, trading, or other types of advice or recommendations supplied or endorsed by TradingView. Read more in the Terms of Use.