
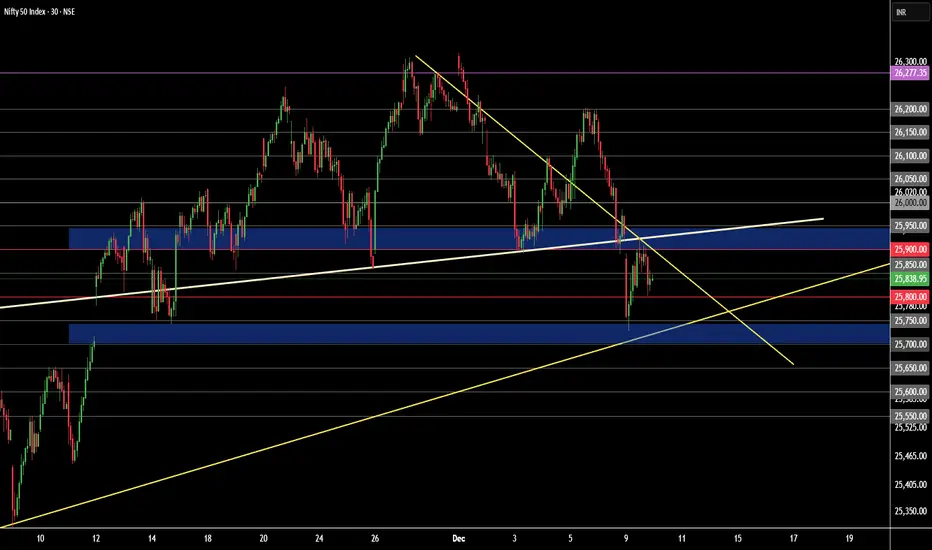
Top-Down Nifty 50 Price Structure Analysis for 10th of December 2025. The day is Wednesday.
(1) Monthly Time Frame:
Red piercing candle. Sign of indecision and trend exhaustion. Major resistance is at level 26000. Major support is at level 25700. The view is indecision to bearish.
(2) Weekly Time Frame:
Red marubozu with weak lower wick. The previous week's candle is also a red hanging man. Today's price gave a breakdown below 3 weeks of consolidation. Signs of trend reversal and previous trend exhaustion. The zone of 25950 - 25900 is a major resistance. The zone of 25750 - 25700 is a major support. The view is bearish.
(3) Daily Time Frame:
Today's candle is kind of a red spinning top or long-legged doji with a small body. The candle shows a breakdown below the level 25900. The day is highly indecisive with a bearish bias. The zone of 25950 - 25900 is a major resistance. The zone of 25750 - 25700 is a major support. The view is bearish.
(4) 30-Minute Time Frame:
Price showed the neck breakdown of the classical head & shoulder (H&S) pattern. The zone 25950 - 25900 is a major resistance. The zone of 25750 - 25700 is a major support. The gap in the zone of 25750 - 25700 still remains unfilled. Today's price broke level 25900 and again got rejected from the same level. Additionally, price strategically expired below the level 25900 but above the level 25800. The price structure of lower highs and lower lows is intact. Thus, the institutional bias is negative. Every up move should be doubted. The view is bearish.
Events:
No expiries on Wednesday. However, the FED interest rate decision is on 11 December (the day after). Expecting high volatility.
Bullish Scenario Set-Up:
(i) Price sustains above the opening price.
(ii) Price starts to build a higher highs and lower lows price structure above the level 26000 (which is a distant level).
(iii) Every up move till the upper breach of level 26000 should be doubted.
Bearish Scenario Set-Up:
(i) Price sustains below the opening price.
(ii) Price starts to trade below the level 25800.
(iii) If the price sustains below the level 25800, there is a higher chance of the price breaking down the level 25700.
No Trading Zone (NTZ): 25900 - 25800.
Hypothesis and Insights from the Trading Plan:
(i) Take bearish trades only as institutional bias is bearish.
(ii) Any up move should be doubted. Bulls are weak.
(iii) The only indication of bullish trades will initiate when the price starts to trade above the level 26000 (which is a distant level). The chances are very low.
(iv) Strong resistance zone is (25950 - 25900).
(v) Minor support zone is (25750 - 25700).
(vi) The neckline of the H&S pattern is broken, confirming the initiation of the bearish phase of at least 400 points (considering the previous range of consolidation).
(vii) If level 25700 is broken, then a free fall is inevitable.
(viii) No Trading Zone (NTZ): (25900 - 25800).
(ix) Trade only when either bullish or bearish conditions are fulfilled. Otherwise, don't trade. Protect your resources.
NOTE:
"Mark your points. Trade your points. Price is God. Anything can happen. Therefore, trade what you see, not what you believe."
Happy Trading!
(1) Monthly Time Frame:
Red piercing candle. Sign of indecision and trend exhaustion. Major resistance is at level 26000. Major support is at level 25700. The view is indecision to bearish.
(2) Weekly Time Frame:
Red marubozu with weak lower wick. The previous week's candle is also a red hanging man. Today's price gave a breakdown below 3 weeks of consolidation. Signs of trend reversal and previous trend exhaustion. The zone of 25950 - 25900 is a major resistance. The zone of 25750 - 25700 is a major support. The view is bearish.
(3) Daily Time Frame:
Today's candle is kind of a red spinning top or long-legged doji with a small body. The candle shows a breakdown below the level 25900. The day is highly indecisive with a bearish bias. The zone of 25950 - 25900 is a major resistance. The zone of 25750 - 25700 is a major support. The view is bearish.
(4) 30-Minute Time Frame:
Price showed the neck breakdown of the classical head & shoulder (H&S) pattern. The zone 25950 - 25900 is a major resistance. The zone of 25750 - 25700 is a major support. The gap in the zone of 25750 - 25700 still remains unfilled. Today's price broke level 25900 and again got rejected from the same level. Additionally, price strategically expired below the level 25900 but above the level 25800. The price structure of lower highs and lower lows is intact. Thus, the institutional bias is negative. Every up move should be doubted. The view is bearish.
Events:
No expiries on Wednesday. However, the FED interest rate decision is on 11 December (the day after). Expecting high volatility.
Bullish Scenario Set-Up:
(i) Price sustains above the opening price.
(ii) Price starts to build a higher highs and lower lows price structure above the level 26000 (which is a distant level).
(iii) Every up move till the upper breach of level 26000 should be doubted.
Bearish Scenario Set-Up:
(i) Price sustains below the opening price.
(ii) Price starts to trade below the level 25800.
(iii) If the price sustains below the level 25800, there is a higher chance of the price breaking down the level 25700.
No Trading Zone (NTZ): 25900 - 25800.
Hypothesis and Insights from the Trading Plan:
(i) Take bearish trades only as institutional bias is bearish.
(ii) Any up move should be doubted. Bulls are weak.
(iii) The only indication of bullish trades will initiate when the price starts to trade above the level 26000 (which is a distant level). The chances are very low.
(iv) Strong resistance zone is (25950 - 25900).
(v) Minor support zone is (25750 - 25700).
(vi) The neckline of the H&S pattern is broken, confirming the initiation of the bearish phase of at least 400 points (considering the previous range of consolidation).
(vii) If level 25700 is broken, then a free fall is inevitable.
(viii) No Trading Zone (NTZ): (25900 - 25800).
(ix) Trade only when either bullish or bearish conditions are fulfilled. Otherwise, don't trade. Protect your resources.
NOTE:
"Mark your points. Trade your points. Price is God. Anything can happen. Therefore, trade what you see, not what you believe."
Happy Trading!

Disclaimer
The information and publications are not meant to be, and do not constitute, financial, investment, trading, or other types of advice or recommendations supplied or endorsed by TradingView. Read more in the Terms of Use.
Disclaimer
The information and publications are not meant to be, and do not constitute, financial, investment, trading, or other types of advice or recommendations supplied or endorsed by TradingView. Read more in the Terms of Use.