
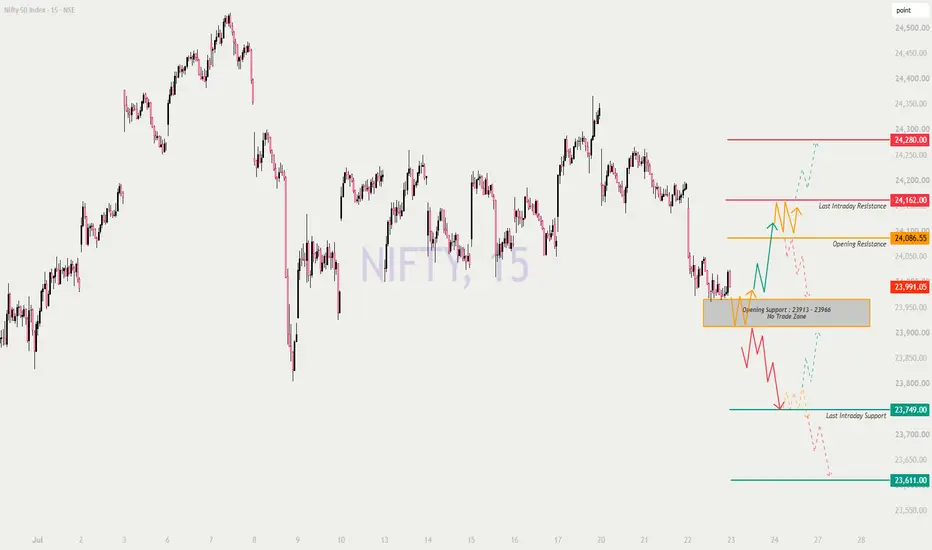
Welcome traders! 👋 Today is a crucial day as we are in the Weekly Expiry session (Thursday). Volatility (Gamma) and Time Decay (Theta) will be at their peak. Here is a detailed, professional trading plan for Nifty 50 based on the 15-minute chart structure.
🎨 Chart Legend & Color Code
Orange Line/Box: No Trade Zone / Sideways Market / Caution Area (Option Sellers' Paradise).
🟢 Green Line: Bullish Zone / Support / Long Side.
Red Line: Bearish Zone / Resistance / Short Side.
⚪ Dashed Line: Probable Trend (Maybe/Maybe Not) – Wait for candle confirmation!
📈 Overall Nifty Trend (Intraday & Expiry Context)
Looking at the chart, Nifty is currently trading around 23,991.
Trend: The market is attempting a recovery but is facing immediate resistance.
Expiry Factor: Since today is the weekly expiry, we expect sharp moves. The market often tries to pin the price near the "Max Pain" level.
Key Battle: The zone between 23,913 (bottom of No Trade Zone) and 24,086 (Opening Resistance) is the immediate battleground.
Current Status: Price (23,991) is hovering just above the No Trade Zone (23,913 - 23,966).
🚀 Scenario 1: Gap Up Opening (100+ Points)
(Expected Open: ~24,090 - 24,100)
If the market gaps up by 100+ points, it will open right at or above the Opening Resistance (24,086.55).
🔍 Analysis: A gap up here is a strong bullish signal, breaking the immediate orange resistance line. However, on expiry day, profit booking can happen instantly at the next red line.
🟢 Bullish Action (Long): If the price sustains above 24,086 for the first 15 minutes, look for a move towards 24,162 (Last Intraday Resistance). A breakout of 24,162 opens the door to 24,280 (following the green dashed line).
🔴 Bearish Action (Short): If the price gaps up but immediately faces selling pressure at 24,086 - 24,100 (forming a bearish candle), it's a "Sell on Rise" opportunity. Target a fall back to 23,991 or the top of the No Trade Zone.
⚠️ No Trade: Avoid buying ATM/OTM calls right at the open if the price is stuck between 24,086 and 24,162.
⚖️ Scenario 2: Flat Opening
(Expected Open: ~23,980 - 24,010)
If the market opens flat, it opens right around the current price (23,991), just above the No Trade Zone (23,913 - 23,966).
** Analysis**: This is the most tricky scenario for Option Buyers. The market is likely to oscillate between 23,913 and 24,086.
🟠 No Trade Zone: The box 23,913 - 23,966 is your "Sideways" area. If the market enters this box, Option Buyers will suffer heavy Theta decay. Stay out!
🟢 Bullish Action (Long): Wait for a strong breakout above 24,086 (Orange Line). Once confirmed, go Long with a target of 24,162.
🔴 Bearish Action (Short): Wait for a breakdown below 23,913 (bottom of the Orange Box). Once confirmed, go Short with a target of 23,749 (Green Line).
⚪ Dashed Line Logic: The chart shows a red dashed line dropping from here and a green solid line rising. The market is at a crossroads. Let the price pick a side!
📉 Scenario 3: Gap Down Opening (100+ Points)
(Expected Open: ~23,890)
If the market gaps down significantly, it opens below the No Trade Zone (23,913 - 23,966) and heads straight towards the Last Intraday Support (23,749).
** Analysis**: This is a bearish continuation. The support at 23,913 has failed.
🔴 Bearish Action (Short): If the price opens below 23,900 and stays there, initiate a Short position. The immediate target is 23,749. If that breaks, look at 23,611 (following the red dashed line).
🟢 Bullish Action (Long): Only look for a "Dead Cat Bounce" or reversal if the price hits 23,749 and shows strong buying interest (Hammer candle). Target a recovery to 23,913.
⚠️ Caution: In a gap down on expiry day, panic selling can be intense. Don't catch the falling knife; wait for stabilization at the green support line.
<br> <br> <br>
🛡️ Risk Management Tips for Options Trading (Expiry Special) 🧠
Since today is weekly expiry, the rules change slightly:
🔹 Beware of Theta Decay: If the market is flat (Scenario 2), Option premiums will melt like ice cream. Option buyers should avoid holding positions for too long in the sideways zone.
🔹 Stop Loss is God: In expiry moves, spikes can be sharp. Always use a system SL. Don't rely on "hope".
🔹 Position Sizing: Volatility can double or halve premiums quickly. Trade with smaller quantities than usual to manage the psychological stress.
🔹 Hero-Zero Trades: If you are trading cheap OTM options (0.50 - 1.00) in the afternoon session, treat it as a lottery ticket. Only use money you are okay losing completely.
🔹 Trail Aggressively: If you are in profit, move your SL to cost immediately. Expiry moves can reverse in minutes.
📝 Summary & Conclusion
To summarize the plan for 23-Jul-2026 (Expiry Day):
Trend: Neutral to Bullish if above 24,086. Bearish if below 23,913.
Gap Up: Bullish above 24,086. Target 24,162 then 24,280.
Flat: NO TRADE in the 23,913 - 23,966 zone. Wait for breakout/breakdown.
Gap Down: Bearish below 23,913. Target 23,749.
Conclusion: The chart highlights a critical "No Trade Zone" (Orange Box) at 23,913 - 23,966. As an educational takeaway: Don't trade in the chop! Let the market break out of the orange box or the orange line (24,086) to give you a clear direction (Green or Red). The dashed lines remind us that until a level is broken, the trend is uncertain. Stay disciplined! 📈
⚠️ Disclaimer:
I am not a SEBI registered analyst. This post is for educational purposes only. Trading in the stock market and F&O involves high risk and can lead to capital loss. Please consult your financial advisor before taking any trades. The charts and levels are based on technical analysis and probabilities, not guarantees.
🎨 Chart Legend & Color Code
Orange Line/Box: No Trade Zone / Sideways Market / Caution Area (Option Sellers' Paradise).
🟢 Green Line: Bullish Zone / Support / Long Side.
Red Line: Bearish Zone / Resistance / Short Side.
⚪ Dashed Line: Probable Trend (Maybe/Maybe Not) – Wait for candle confirmation!
📈 Overall Nifty Trend (Intraday & Expiry Context)
Looking at the chart, Nifty is currently trading around 23,991.
Trend: The market is attempting a recovery but is facing immediate resistance.
Expiry Factor: Since today is the weekly expiry, we expect sharp moves. The market often tries to pin the price near the "Max Pain" level.
Key Battle: The zone between 23,913 (bottom of No Trade Zone) and 24,086 (Opening Resistance) is the immediate battleground.
Current Status: Price (23,991) is hovering just above the No Trade Zone (23,913 - 23,966).
🚀 Scenario 1: Gap Up Opening (100+ Points)
(Expected Open: ~24,090 - 24,100)
If the market gaps up by 100+ points, it will open right at or above the Opening Resistance (24,086.55).
🔍 Analysis: A gap up here is a strong bullish signal, breaking the immediate orange resistance line. However, on expiry day, profit booking can happen instantly at the next red line.
🟢 Bullish Action (Long): If the price sustains above 24,086 for the first 15 minutes, look for a move towards 24,162 (Last Intraday Resistance). A breakout of 24,162 opens the door to 24,280 (following the green dashed line).
🔴 Bearish Action (Short): If the price gaps up but immediately faces selling pressure at 24,086 - 24,100 (forming a bearish candle), it's a "Sell on Rise" opportunity. Target a fall back to 23,991 or the top of the No Trade Zone.
⚠️ No Trade: Avoid buying ATM/OTM calls right at the open if the price is stuck between 24,086 and 24,162.
⚖️ Scenario 2: Flat Opening
(Expected Open: ~23,980 - 24,010)
If the market opens flat, it opens right around the current price (23,991), just above the No Trade Zone (23,913 - 23,966).
** Analysis**: This is the most tricky scenario for Option Buyers. The market is likely to oscillate between 23,913 and 24,086.
🟠 No Trade Zone: The box 23,913 - 23,966 is your "Sideways" area. If the market enters this box, Option Buyers will suffer heavy Theta decay. Stay out!
🟢 Bullish Action (Long): Wait for a strong breakout above 24,086 (Orange Line). Once confirmed, go Long with a target of 24,162.
🔴 Bearish Action (Short): Wait for a breakdown below 23,913 (bottom of the Orange Box). Once confirmed, go Short with a target of 23,749 (Green Line).
⚪ Dashed Line Logic: The chart shows a red dashed line dropping from here and a green solid line rising. The market is at a crossroads. Let the price pick a side!
📉 Scenario 3: Gap Down Opening (100+ Points)
(Expected Open: ~23,890)
If the market gaps down significantly, it opens below the No Trade Zone (23,913 - 23,966) and heads straight towards the Last Intraday Support (23,749).
** Analysis**: This is a bearish continuation. The support at 23,913 has failed.
🔴 Bearish Action (Short): If the price opens below 23,900 and stays there, initiate a Short position. The immediate target is 23,749. If that breaks, look at 23,611 (following the red dashed line).
🟢 Bullish Action (Long): Only look for a "Dead Cat Bounce" or reversal if the price hits 23,749 and shows strong buying interest (Hammer candle). Target a recovery to 23,913.
⚠️ Caution: In a gap down on expiry day, panic selling can be intense. Don't catch the falling knife; wait for stabilization at the green support line.
<br> <br> <br>
🛡️ Risk Management Tips for Options Trading (Expiry Special) 🧠
Since today is weekly expiry, the rules change slightly:
🔹 Beware of Theta Decay: If the market is flat (Scenario 2), Option premiums will melt like ice cream. Option buyers should avoid holding positions for too long in the sideways zone.
🔹 Stop Loss is God: In expiry moves, spikes can be sharp. Always use a system SL. Don't rely on "hope".
🔹 Position Sizing: Volatility can double or halve premiums quickly. Trade with smaller quantities than usual to manage the psychological stress.
🔹 Hero-Zero Trades: If you are trading cheap OTM options (0.50 - 1.00) in the afternoon session, treat it as a lottery ticket. Only use money you are okay losing completely.
🔹 Trail Aggressively: If you are in profit, move your SL to cost immediately. Expiry moves can reverse in minutes.
📝 Summary & Conclusion
To summarize the plan for 23-Jul-2026 (Expiry Day):
Trend: Neutral to Bullish if above 24,086. Bearish if below 23,913.
Gap Up: Bullish above 24,086. Target 24,162 then 24,280.
Flat: NO TRADE in the 23,913 - 23,966 zone. Wait for breakout/breakdown.
Gap Down: Bearish below 23,913. Target 23,749.
Conclusion: The chart highlights a critical "No Trade Zone" (Orange Box) at 23,913 - 23,966. As an educational takeaway: Don't trade in the chop! Let the market break out of the orange box or the orange line (24,086) to give you a clear direction (Green or Red). The dashed lines remind us that until a level is broken, the trend is uncertain. Stay disciplined! 📈
⚠️ Disclaimer:
I am not a SEBI registered analyst. This post is for educational purposes only. Trading in the stock market and F&O involves high risk and can lead to capital loss. Please consult your financial advisor before taking any trades. The charts and levels are based on technical analysis and probabilities, not guarantees.

Related publications
Disclaimer
The information and publications are not meant to be, and do not constitute, financial, investment, trading, or other types of advice or recommendations supplied or endorsed by TradingView. Read more in the Terms of Use.
Related publications
Disclaimer
The information and publications are not meant to be, and do not constitute, financial, investment, trading, or other types of advice or recommendations supplied or endorsed by TradingView. Read more in the Terms of Use.