
After my previous bullish take on Nifty (see linked related publications), the view has now flipped.
And no — it’s not because the US indices are cracking.
And no — it’s not because Bitcoin is collapsing and draining liquidity.
Those may add pressure, sure.
But the core reason I’m turning bearish is right on the chart — in the structure itself.
Daily Chart – Why the Tone Has Changed
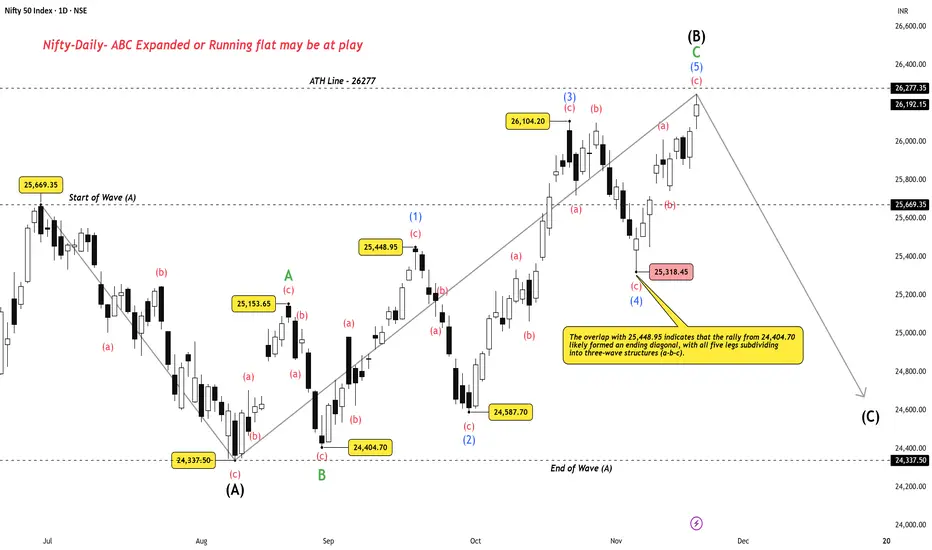
The key shift came from the overlap at 25,448.95, which strongly hints that the rally from 24,404.70 unfolded as an ending diagonal, with all five legs subdividing into 3-wave structures (a-b-c).
This overlap is what invalidates the impulsive interpretation and turns the structure corrective.
That means the entire rise into wave (B) likely finishes a B-wave top, and Nifty may now be moving into wave (C) down.
At this point, Nifty could be forming either:
Both are bearish in the short-term and typically resolve with a deeper C-wave.
And honestly, there is zero point chasing this market unless we get a decisive close above the ATH — whether on the daily, the weekly, or especially the monthly, which is about to complete and should give a clean directional clue.
Until that happens, the risk–reward on fresh longs is questionable.
This entire bearish view gets invalidated only if Nifty posts a strong, sustained close above the ATH on higher timeframes.
Weekly Chart – Resistance Stack Remains Heavy

The weekly structure adds more weight to the bearish bias:
This is a classic “let the market prove itself” zone.
Summary
Disclaimer: This analysis is for educational purposes only and does not constitute investment advice. Please do your own research (DYOR) before making any trading decisions.
And no — it’s not because the US indices are cracking.
And no — it’s not because Bitcoin is collapsing and draining liquidity.
Those may add pressure, sure.
But the core reason I’m turning bearish is right on the chart — in the structure itself.
Daily Chart – Why the Tone Has Changed
The key shift came from the overlap at 25,448.95, which strongly hints that the rally from 24,404.70 unfolded as an ending diagonal, with all five legs subdividing into 3-wave structures (a-b-c).
This overlap is what invalidates the impulsive interpretation and turns the structure corrective.
That means the entire rise into wave (B) likely finishes a B-wave top, and Nifty may now be moving into wave (C) down.
At this point, Nifty could be forming either:
- An ABC Expanded Flat, or
- A Running Flat
Both are bearish in the short-term and typically resolve with a deeper C-wave.
And honestly, there is zero point chasing this market unless we get a decisive close above the ATH — whether on the daily, the weekly, or especially the monthly, which is about to complete and should give a clean directional clue.
Until that happens, the risk–reward on fresh longs is questionable.
This entire bearish view gets invalidated only if Nifty posts a strong, sustained close above the ATH on higher timeframes.
Weekly Chart – Resistance Stack Remains Heavy
The weekly structure adds more weight to the bearish bias:
- Nifty is testing the ATH zone, a major psychological resistance.
- Price is also hitting the rising trendline, which has already rejected earlier attempts.
- Both these zones converge right at current levels — not the best place to be aggressive on longs.
This is a classic “let the market prove itself” zone.
Summary
- The structure has shifted to corrective due to the ending diagonal overlap.
- Daily chart suggests an Expanded or Running Flat scenario.
- Weekly chart shows dual resistance — ATH + rising trendline.
- No fresh longs unless there’s a clean breakout above ATH on higher timeframes.
- Monthly candle close will be crucial.
- Patience > prediction. Let the structure confirm before acting.
Disclaimer: This analysis is for educational purposes only and does not constitute investment advice. Please do your own research (DYOR) before making any trading decisions.
Trade active
It looks like the B-wave topped at 2633.25, right at the midpoint of the ascending channel. From that peak, the structure is starting to resemble an early Wave 1 leading diagonal to the downside. Waves 1–2–3 appear complete, and the current movment is likely Wave 4, with a potential Wave 5 leg still pending.
Will refine the count as price action unfolds.
Note
Typo: (B)-wave topped at 26325.80Note
Wave 2 could be forming an ABC zigzag, with today's fall sitting exactly at 0.618 fib level of the wave (A) rally. This could mark wave (B) completion. We could now see a push upwards to complete the wave (C) of the zigzag.

WaveXplorer | Elliott Wave insights
📊 X profile: @veerappa89
📊 X profile: @veerappa89
Related publications
Disclaimer
The information and publications are not meant to be, and do not constitute, financial, investment, trading, or other types of advice or recommendations supplied or endorsed by TradingView. Read more in the Terms of Use.
WaveXplorer | Elliott Wave insights
📊 X profile: @veerappa89
📊 X profile: @veerappa89
Related publications
Disclaimer
The information and publications are not meant to be, and do not constitute, financial, investment, trading, or other types of advice or recommendations supplied or endorsed by TradingView. Read more in the Terms of Use.