
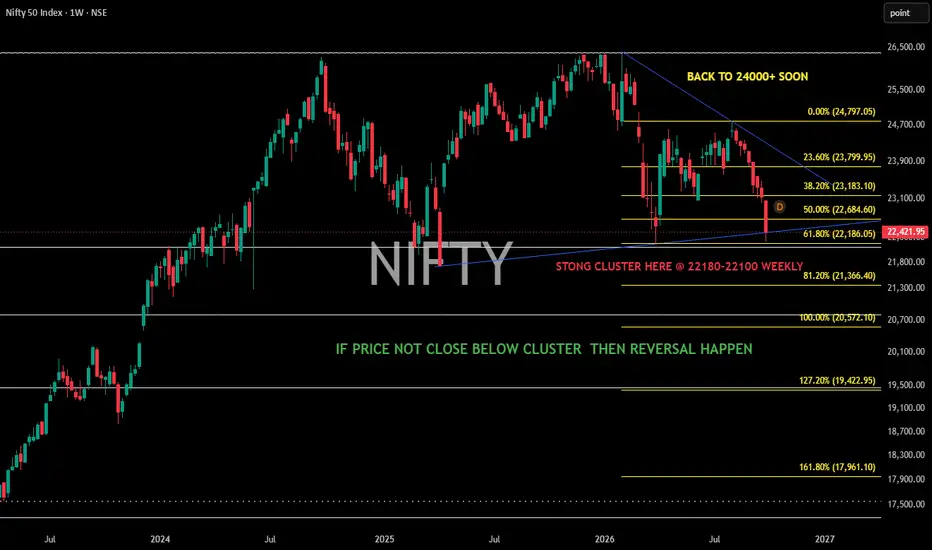
NIFTY — Weekly Timeframe
NIFTY is currently approaching a strong weekly support cluster around 22,180–22,100.
This zone has multiple technical confluences:
Trendline Support — price is approaching the rising weekly trendline.
61.8% Fibonacci Support — 61.8% level is around 22,186.
Fibonacci Extension/Projection — the extension structure also places an important area around this zone.
Price-Based Support — 22,180–22,100 is the key weekly closing support area.
Key Observation
If NIFTY holds this cluster and does not give a decisive weekly close below 22,100, the zone could act as a base for a reversal/recovery.
On the upside, the first important area is the 23,800–24,000 zone, followed by the 24,797 area.
Invalidation: A decisive weekly close below the 22,100 support cluster would weaken this setup.
This idea is based purely on trendline, Fibonacci and price-structure confluence.
NIFTY is currently approaching a strong weekly support cluster around 22,180–22,100.
This zone has multiple technical confluences:
Trendline Support — price is approaching the rising weekly trendline.
61.8% Fibonacci Support — 61.8% level is around 22,186.
Fibonacci Extension/Projection — the extension structure also places an important area around this zone.
Price-Based Support — 22,180–22,100 is the key weekly closing support area.
Key Observation
If NIFTY holds this cluster and does not give a decisive weekly close below 22,100, the zone could act as a base for a reversal/recovery.
On the upside, the first important area is the 23,800–24,000 zone, followed by the 24,797 area.
Invalidation: A decisive weekly close below the 22,100 support cluster would weaken this setup.
This idea is based purely on trendline, Fibonacci and price-structure confluence.
Trade active
Update — Oct 15The 22,180–22,100 weekly support cluster held. NIFTY made a low near 22,217, did not give a weekly close below the zone, and has since recovered to around 23,050 (~830 points from the low).
Price is now approaching the first resistance area: the 38.2% Fibonacci level (~23,183) and the falling trendline from the top. A weekly close above 23,200 would strengthen the recovery case toward the 23,800–24,000 zone, followed by 24,797.
If price gets rejected here, 22,700–22,600 (50% level) is the first support to watch. The original invalidation stays the same: a decisive weekly close below 22,100.
Based purely on trendline, Fibonacci and price-structure confluence. Not a recommendation.
Trade closed: target reached
### Update – November 2 | Recovery Milestone ReachedThe weekly support cluster identified at 22,180–22,100 has held, with NIFTY recording a low near 22,217.
Following the recovery, the index has now reached 23,440, marking an important milestone in the bullish recovery scenario discussed in the original analysis.
**What has happened:**
- Weekly support cluster held.
- Price recovered approximately 1,223 points from the 22,217 low.
- The 23,183 resistance level was crossed.
- The index has reached 23,440.
**What to watch next:**
The next major upside zone remains 23,800–24,000, followed by 24,797.
A sustained move above the immediate resistance area would strengthen the broader recovery scenario.
The original invalidation level remains unchanged: a decisive weekly close below 22,100 would weaken this setup.
This update documents the actual price development against the original analysis.
Based on weekly structure, trendline and Fibonacci confluence. Not a financial recommendation.

Disclaimer
The information and publications are not meant to be, and do not constitute, financial, investment, trading, or other types of advice or recommendations supplied or endorsed by TradingView. Read more in the Terms of Use.
Disclaimer
The information and publications are not meant to be, and do not constitute, financial, investment, trading, or other types of advice or recommendations supplied or endorsed by TradingView. Read more in the Terms of Use.