
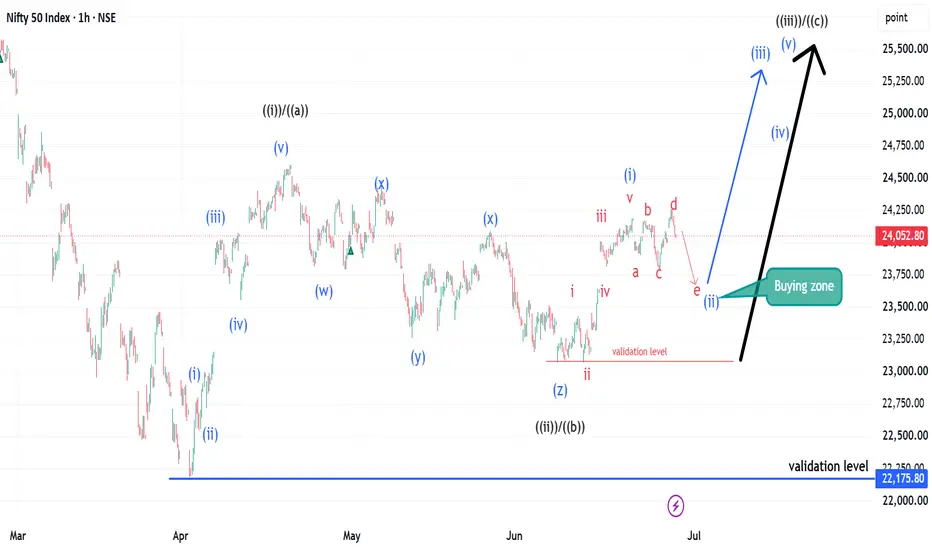
we shared our ideas with you on 30th April 26 on 1 hour chart of Nifty, let us review the same and take it forward. First let me explain to you that market moves in impulsive moves and corrective moves, we study and read this so that we can understand which move is impulsive and which move is corrective phase, on the basis of this the corrective phase started from 21st April 26, in this phase instead of making simple ABC corrective wave, complex WXYZ corrective waves were made, the market has already completed this corrective phase and has started a new impulsive phase.
Now, let's study further. We'll separate these movements into different degrees so we can understand them by degree.
The degree is understood by their name and color coding.
Now, we're studying Nifty's 1-hour timeframe charts, so we'll explain them.
The market recently made a low of 22182 on 2 April , and a top of 24601 on 21 April. This is an impulsive move.
We have marked this degree as Minor Degree ((i))/((a)) in black color.
after that correction phase is made as WXYZ internal structure minuette degree in blue color which is complete at 23072 of minor degree ((ii))/((b)) wave.
Minor Degree ((iii))/((c)) is in progress.
From 23072 to 24189 an impulsive move occurs as internal structure i, ii, iii, iv, v Sub-minutte degree red in color
which we will keep (i) of Minute blue in color and after that correction phase is going on, as soon as the correction is completed a new impulse wave will start.
Let us discuss where wave(ii) can be completed ?
At this time, it is important to read the type of correction forming on the Nifty chart. Only then will the next impulse wave form. As per my experience, we can read that it should be a shallow correction. Now the question arises that what types of corrections are formed in a shallow correction. So, two types of corrections are formed - Flat and Triangle correction. Here, a flat correction was formed but it failed. Now, which one will be formed? A triangle will be formed. That too, what type of triangle am I seeing? It is an expanded type triangle whose last leg is the e wave pending or e wave should be completed around 23650.Wave 'e' of the triangle will mark wave (ii) of minuette degree in blue color. As soon as this wave is completed, a new impulse wave will emerge from here.
I cannot explain it in a simpler way than this and the degrees are marked on the chart with color and validation levels are marked with arrows.
Thanks
Disclaimer: I am not a SEBI registered financial advisor. Consult your financial advisor before making any trade or investment. This is being shared for educational purposes only.
MKT Learner
Now, let's study further. We'll separate these movements into different degrees so we can understand them by degree.
The degree is understood by their name and color coding.
Now, we're studying Nifty's 1-hour timeframe charts, so we'll explain them.
The market recently made a low of 22182 on 2 April , and a top of 24601 on 21 April. This is an impulsive move.
We have marked this degree as Minor Degree ((i))/((a)) in black color.
after that correction phase is made as WXYZ internal structure minuette degree in blue color which is complete at 23072 of minor degree ((ii))/((b)) wave.
Minor Degree ((iii))/((c)) is in progress.
From 23072 to 24189 an impulsive move occurs as internal structure i, ii, iii, iv, v Sub-minutte degree red in color
which we will keep (i) of Minute blue in color and after that correction phase is going on, as soon as the correction is completed a new impulse wave will start.
Let us discuss where wave(ii) can be completed ?
At this time, it is important to read the type of correction forming on the Nifty chart. Only then will the next impulse wave form. As per my experience, we can read that it should be a shallow correction. Now the question arises that what types of corrections are formed in a shallow correction. So, two types of corrections are formed - Flat and Triangle correction. Here, a flat correction was formed but it failed. Now, which one will be formed? A triangle will be formed. That too, what type of triangle am I seeing? It is an expanded type triangle whose last leg is the e wave pending or e wave should be completed around 23650.Wave 'e' of the triangle will mark wave (ii) of minuette degree in blue color. As soon as this wave is completed, a new impulse wave will emerge from here.
I cannot explain it in a simpler way than this and the degrees are marked on the chart with color and validation levels are marked with arrows.
Thanks
Disclaimer: I am not a SEBI registered financial advisor. Consult your financial advisor before making any trade or investment. This is being shared for educational purposes only.
MKT Learner

Related publications
Disclaimer
The information and publications are not meant to be, and do not constitute, financial, investment, trading, or other types of advice or recommendations supplied or endorsed by TradingView. Read more in the Terms of Use.
Related publications
Disclaimer
The information and publications are not meant to be, and do not constitute, financial, investment, trading, or other types of advice or recommendations supplied or endorsed by TradingView. Read more in the Terms of Use.