
🟢 Nifty Analysis EOD – May 12, 2026 – Tuesday 🔴
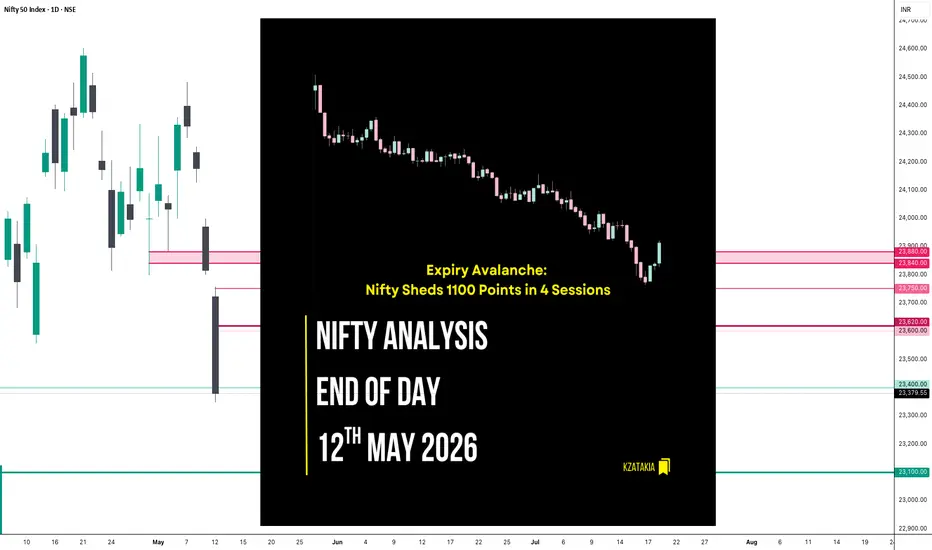
Expiry Avalanche: Nifty Sheds 1100 Points in 4 Sessions
🗞 Nifty Summary
Today’s weekly expiry was a masterclass in one-sided bearish momentum.
Nifty opened with a 93-point Gap Down, and after a quiet first 5 minutes, it fell another 144 points from the high to establish the Initial Balance Low (IBL) at 23613.55. The index remained stuck for about 90 minutes, consolidating between the IBL and the 23590 support zone. At 12:05 PM, the floor finally gave way. What followed was a “free flow” decline that respected the intraday trendline with perfect precision; not a single swing high was breached during the slide.
The index sliced through the 23,400 support zone with ease, eventually testing 23350. A minor 86-point recovery in the final 15 minutes did little to change the narrative, as the market ended at 23,430 (Adjusted Close: 23,379.55), losing −436.30 points (−1.83%).
This move was surprisingly neat and clean according to price action, though the intensity was far beyond expectations.
Nifty has now lost a staggering 1100 points in just 4 trading sessions and has closed below its previous 21-session low (33 days).
🛡 5 Min Intraday Chart with Levels

📉 Daily Time Frame Chart with Intraday Levels

🕯 Daily Candle Breakdown
Open: 23,722.60
High: 23,757.55
Low: 23,348.40
Close: 23,379.55
Change: −436.30 (−1.83%)
🏗️ Structure Breakdown
Type: Strong Bearish Candle (Trend Expansion).
Range: ≈ 409 points — Very high volatility.
Body: ≈ 343 points — Aggressive and dominant selling pressure.
Upper Wick: ≈ 35 points — Minimal buying conviction near the open.
Lower Wick: ≈ 31 points — Negligible buying interest even at the day’s bottom.
🛡 5 Min Intraday Chart

⚔️ Gladiator Strategy Update
ATR: 332.16
IB Range: 139.85 → Medium
Market Structure: ImBalanced
Trade Highlights:
11:02 Short Trade: Target Hit (R:R 1:3.45) (IBL Breakdown).
Trade Summary:
Today, I chose to be very protective of my capital. I managed to catch a great short move at 11:02 AM after the IBL broke, which hit my target for a solid 1:3.45 reward. However, I feel quite frustrated and regretful now. I was too protective of my initial profit and decided to sit out another trade that triggered at 1:41 PM. That move would have added more than 100 points, but I let my fear of giving back gains stop me. It’s a bitter pill to swallow when you follow the rules but realize your psychology kept you from a much bigger day.
🧱 Support & Resistance Levels
Resistance Zones: 23600 ~ 23620 | 23750 | 23840 ~ 23880
Support Zones: 23400 | 23100 (Major Floor)
🧠 Final Thoughts
“A trend doesn’t need to explain its speed; it only needs to be respected.”
The breakdown today has been brutal and efficient. Closing below the 33-day low has opened up a new bearish leg.
For tomorrow, the opening tick will again be the primary clue. If Nifty gaps down further, the next major support is waiting at 23,100.
Conversely, any recovery attempt will find a heavy ceiling in the 23,600 ~ 23,660 zone. I’ll try to clear my head of today’s missed points, stay humble, and follow the trend rather than trying to guess the bottom.
✏️ Disclaimer
This is my personal digital diary and represents my own analysis and point of view. It is not financial advice; please consult a professional advisor before making any trading decisions.
Expiry Avalanche: Nifty Sheds 1100 Points in 4 Sessions
🗞 Nifty Summary
Today’s weekly expiry was a masterclass in one-sided bearish momentum.
Nifty opened with a 93-point Gap Down, and after a quiet first 5 minutes, it fell another 144 points from the high to establish the Initial Balance Low (IBL) at 23613.55. The index remained stuck for about 90 minutes, consolidating between the IBL and the 23590 support zone. At 12:05 PM, the floor finally gave way. What followed was a “free flow” decline that respected the intraday trendline with perfect precision; not a single swing high was breached during the slide.
The index sliced through the 23,400 support zone with ease, eventually testing 23350. A minor 86-point recovery in the final 15 minutes did little to change the narrative, as the market ended at 23,430 (Adjusted Close: 23,379.55), losing −436.30 points (−1.83%).
This move was surprisingly neat and clean according to price action, though the intensity was far beyond expectations.
Nifty has now lost a staggering 1100 points in just 4 trading sessions and has closed below its previous 21-session low (33 days).
🛡 5 Min Intraday Chart with Levels
📉 Daily Time Frame Chart with Intraday Levels
🕯 Daily Candle Breakdown
Open: 23,722.60
High: 23,757.55
Low: 23,348.40
Close: 23,379.55
Change: −436.30 (−1.83%)
🏗️ Structure Breakdown
Type: Strong Bearish Candle (Trend Expansion).
Range: ≈ 409 points — Very high volatility.
Body: ≈ 343 points — Aggressive and dominant selling pressure.
Upper Wick: ≈ 35 points — Minimal buying conviction near the open.
Lower Wick: ≈ 31 points — Negligible buying interest even at the day’s bottom.
🛡 5 Min Intraday Chart
⚔️ Gladiator Strategy Update
ATR: 332.16
IB Range: 139.85 → Medium
Market Structure: ImBalanced
Trade Highlights:
11:02 Short Trade: Target Hit (R:R 1:3.45) (IBL Breakdown).
Trade Summary:
Today, I chose to be very protective of my capital. I managed to catch a great short move at 11:02 AM after the IBL broke, which hit my target for a solid 1:3.45 reward. However, I feel quite frustrated and regretful now. I was too protective of my initial profit and decided to sit out another trade that triggered at 1:41 PM. That move would have added more than 100 points, but I let my fear of giving back gains stop me. It’s a bitter pill to swallow when you follow the rules but realize your psychology kept you from a much bigger day.
🧱 Support & Resistance Levels
Resistance Zones: 23600 ~ 23620 | 23750 | 23840 ~ 23880
Support Zones: 23400 | 23100 (Major Floor)
🧠 Final Thoughts
“A trend doesn’t need to explain its speed; it only needs to be respected.”
The breakdown today has been brutal and efficient. Closing below the 33-day low has opened up a new bearish leg.
For tomorrow, the opening tick will again be the primary clue. If Nifty gaps down further, the next major support is waiting at 23,100.
Conversely, any recovery attempt will find a heavy ceiling in the 23,600 ~ 23,660 zone. I’ll try to clear my head of today’s missed points, stay humble, and follow the trend rather than trying to guess the bottom.
✏️ Disclaimer
This is my personal digital diary and represents my own analysis and point of view. It is not financial advice; please consult a professional advisor before making any trading decisions.

Read my blogs here:
substack.com/@kzatakia
Follow me on Telegram:
t.me/swingtraderhub
Follow me on X:
x.com/kzatakia
substack.com/@kzatakia
Follow me on Telegram:
t.me/swingtraderhub
Follow me on X:
x.com/kzatakia
Related publications
Disclaimer
The information and publications are not meant to be, and do not constitute, financial, investment, trading, or other types of advice or recommendations supplied or endorsed by TradingView. Read more in the Terms of Use.
Read my blogs here:
substack.com/@kzatakia
Follow me on Telegram:
t.me/swingtraderhub
Follow me on X:
x.com/kzatakia
substack.com/@kzatakia
Follow me on Telegram:
t.me/swingtraderhub
Follow me on X:
x.com/kzatakia
Related publications
Disclaimer
The information and publications are not meant to be, and do not constitute, financial, investment, trading, or other types of advice or recommendations supplied or endorsed by TradingView. Read more in the Terms of Use.