
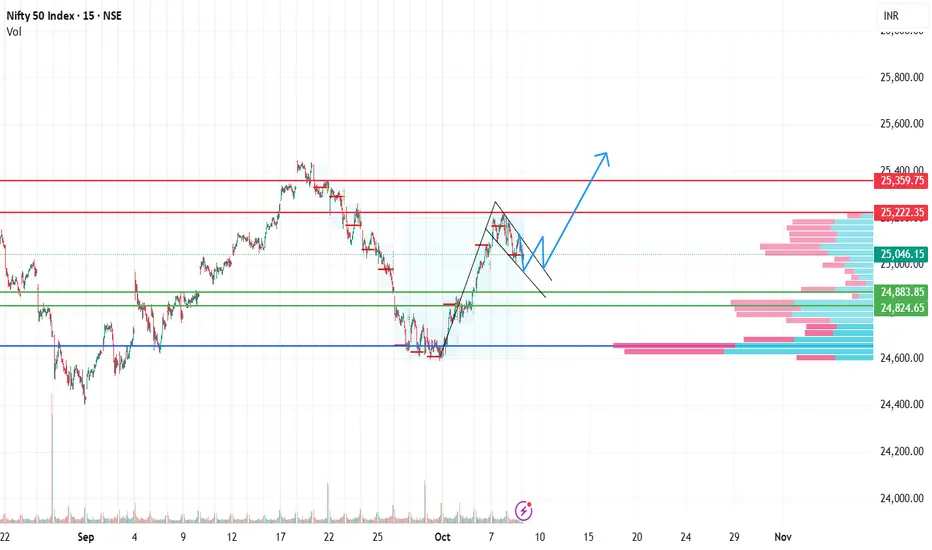
The Nifty 50 index on the 5-minute and 15-minute timeframe is showing a bullish pole and flag continuation pattern. After a strong upward rally (the pole), the price has entered a downward-sloping consolidation channel (the flag), indicating healthy profit booking. The pattern suggests potential for a breakout on the upside, resuming the prior bullish trend.
Key levels to watch:
Support: 24,824 – 24,883 zone (green lines)
Resistance: 25,222 and 25,359 (red lines)
Breakout Target Zone: Above 25,400 if price sustains above the flag channel resistance.
The volume profile also indicates strong accumulation near 25,000, further strengthening the bullish bias.
Key levels to watch:
Support: 24,824 – 24,883 zone (green lines)
Resistance: 25,222 and 25,359 (red lines)
Breakout Target Zone: Above 25,400 if price sustains above the flag channel resistance.
The volume profile also indicates strong accumulation near 25,000, further strengthening the bullish bias.

Disclaimer
The information and publications are not meant to be, and do not constitute, financial, investment, trading, or other types of advice or recommendations supplied or endorsed by TradingView. Read more in the Terms of Use.
Disclaimer
The information and publications are not meant to be, and do not constitute, financial, investment, trading, or other types of advice or recommendations supplied or endorsed by TradingView. Read more in the Terms of Use.