
Overview
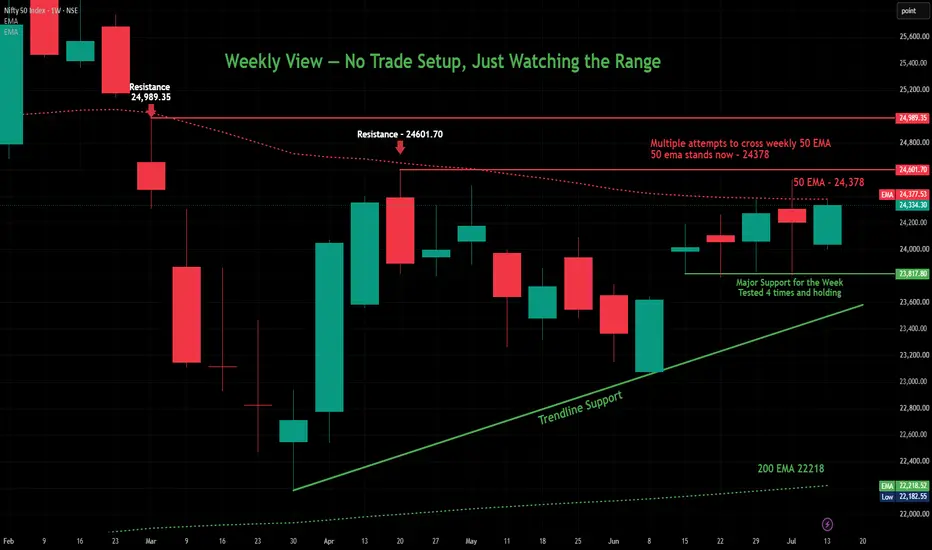
Quick weekend look at the bigger picture on Nifty. On the weekly chart, two things stand out right now: a rising trendline support that's been holding nicely, and a resistance zone around the Weekly 50 EMA that price keeps trying (and failing) to clear.
What's Happening
Since the March low, Nifty has been climbing steadily along a rising trendline, currently sitting under the price. That trendline has done its job well so far — every dip toward it has found buyers.
At the same time, price has made a few attempts to break above the Weekly 50 EMA (currently at 24,378) and the resistance zone around 24,601–24,989, but hasn't managed a clean breakout yet. You can see two clear rejection points marked on the chart where price pushed into this zone and got pushed back.
There's also a support zone around 23,817 that's been tested four times now and has held each time — that's a pretty reliable level at this point.
Key Levels
Resistance Zone: 24,378 (Weekly 50 EMA) to 24,601–24,989
Support Zone (tested 4 times): 23,817
Trendline Support: rising, currently well below price, adding a longer-term floor
The Bigger Picture
Right now, Nifty is stuck between a well-tested support below and a resistance zone that keeps rejecting it above. Until one of these gives way clearly, we're likely to keep seeing this back-and-forth kind of price action.
What Would Change the Picture
A clean weekly close above 24,601 would be a good sign buyers are finally taking control of the bigger trend
A break below 23,817, especially with the trendline support also giving way, would be the first real sign this uptrend structure is in trouble
Beginner's Lesson
When a stock or index keeps failing at the same zone multiple times, it doesn't mean it will never break through — it just means buyers haven't found enough strength yet. The more times a level gets tested without breaking, the more important it becomes when it eventually does break, in either direction.
Conclusion
Nifty remains range-bound between strong support below and a tough resistance zone above. No clear signal yet either way — just watching how these two boundaries play out over the coming weeks.
For educational purposes only. Not financial advice.
Quick weekend look at the bigger picture on Nifty. On the weekly chart, two things stand out right now: a rising trendline support that's been holding nicely, and a resistance zone around the Weekly 50 EMA that price keeps trying (and failing) to clear.
What's Happening
Since the March low, Nifty has been climbing steadily along a rising trendline, currently sitting under the price. That trendline has done its job well so far — every dip toward it has found buyers.
At the same time, price has made a few attempts to break above the Weekly 50 EMA (currently at 24,378) and the resistance zone around 24,601–24,989, but hasn't managed a clean breakout yet. You can see two clear rejection points marked on the chart where price pushed into this zone and got pushed back.
There's also a support zone around 23,817 that's been tested four times now and has held each time — that's a pretty reliable level at this point.
Key Levels
Resistance Zone: 24,378 (Weekly 50 EMA) to 24,601–24,989
Support Zone (tested 4 times): 23,817
Trendline Support: rising, currently well below price, adding a longer-term floor
The Bigger Picture
Right now, Nifty is stuck between a well-tested support below and a resistance zone that keeps rejecting it above. Until one of these gives way clearly, we're likely to keep seeing this back-and-forth kind of price action.
What Would Change the Picture
A clean weekly close above 24,601 would be a good sign buyers are finally taking control of the bigger trend
A break below 23,817, especially with the trendline support also giving way, would be the first real sign this uptrend structure is in trouble
Beginner's Lesson
When a stock or index keeps failing at the same zone multiple times, it doesn't mean it will never break through — it just means buyers haven't found enough strength yet. The more times a level gets tested without breaking, the more important it becomes when it eventually does break, in either direction.
Conclusion
Nifty remains range-bound between strong support below and a tough resistance zone above. No clear signal yet either way — just watching how these two boundaries play out over the coming weeks.
For educational purposes only. Not financial advice.
Note
The Support We Were Watching Has Broken
Time to be honest about this one. Since our last post, Nifty had a rough week — down 2.33%, closing at 23,767.45. This is a meaningful development: the trendline support and the horizontal support zone we were tracking (23,817.80) have now broken.
What's Changed:
The Major Support (tested 4 times and holding, from our original post) finally gave way this week
The rising trendline support has also been broken — you can see this week's candle has slipped below both the horizontal line and the green trendline
Price is now trading at 23,767.45, below both these levels
Where This Leaves Us:
The bigger picture hasn't fallen apart — the 200 Weekly EMA is still way down at 22,233, so there's a lot of room before any real structural damage. But this week's break is the first real crack in what had been a fairly reliable support zone.
What to Watch Now:
Immediate zone: 23,606–23,767 — does this hold as a new support, or does the slide continue?
Resistance above: 24,353 (50 EMA), then 24,601–24,989 further up — these haven't changed and remain the tougher zone to clear
Bigger support below: 200 EMA around 22,233, still quite far away
Bottom Line:
The support we'd been tracking for weeks has broken, and that's worth taking seriously rather than brushing aside. This doesn't mean the bigger uptrend is over, but it does mean the "stuck between strong support and resistance" story from our last post needs an update — support just lost this round. We'll be watching closely to see if this is a shakeout or the start of something bigger.
For educational purposes only. Not financial advice. Always manage your risk.
Trade closed: target reached

📈 HK Trading Community | Market Structure & Indicator Updates
Telegram: t.me/trendstrike1000
Website: quantumedgepro.netlify.app/
Real traders are built through learning,not tip hunting.So Start Learning How the Market Really Works
Telegram: t.me/trendstrike1000
Website: quantumedgepro.netlify.app/
Real traders are built through learning,not tip hunting.So Start Learning How the Market Really Works
Related publications
Disclaimer
The information and publications are not meant to be, and do not constitute, financial, investment, trading, or other types of advice or recommendations supplied or endorsed by TradingView. Read more in the Terms of Use.
📈 HK Trading Community | Market Structure & Indicator Updates
Telegram: t.me/trendstrike1000
Website: quantumedgepro.netlify.app/
Real traders are built through learning,not tip hunting.So Start Learning How the Market Really Works
Telegram: t.me/trendstrike1000
Website: quantumedgepro.netlify.app/
Real traders are built through learning,not tip hunting.So Start Learning How the Market Really Works
Related publications
Disclaimer
The information and publications are not meant to be, and do not constitute, financial, investment, trading, or other types of advice or recommendations supplied or endorsed by TradingView. Read more in the Terms of Use.