
This is Part 3 of the Weekly Analysis series. Do refer to the first two parts for context:
🔴 Part 1 — Kumo Breakdown + Kihon Suchi
Bears strengthened at every Kihon Suchi Simple Number Bar (9, 17, 26), with the 33rd Composite Number Bar next in focus.
⚪ Part 2 — The Magical Range
The 33rd week printed a Bullish Harami instead of bearish continuation, leading us to map the Bulls, Bears & Kangaroo territorial ranges.
Now, let’s dissect the T/K intersection to see if the bullish case has further evidence.
Ichimoku’s 9, 26 & 52 are not arbitrary — they represent short-, medium- and long-term equilibrium horizons.
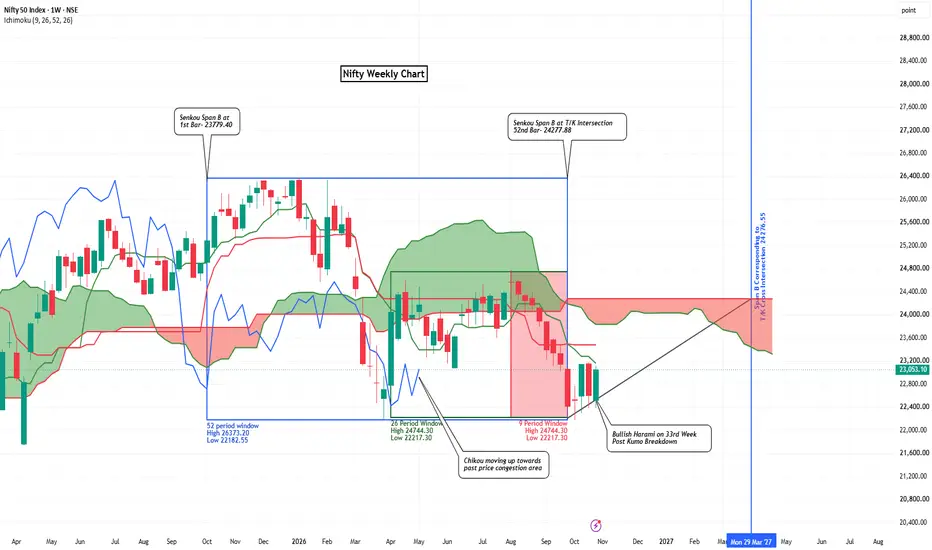
Taking the T/K intersection candle as Bar 1, we look backward and construct fixed High/Low rectangles:
🔹 9W → short-term equilibrium
🔹 26W → medium-term equilibrium
🔹 52W → long-term structural stability equilibrium
We also draw a diagonal trajectory from the T/K intersection candle Low toward projected Span B at +26 periods — a trajectory hypothesis, not conventional support.
And the geometry gets interesting.
9W & 26W: 24,744.30 – 22,217.30
52W: 26,373.20 – 22,182.55
The downside boundaries are tightly clustered at 22,217–22,183.
Span B evolves:
23,779.40 → 24,277.88 → 24,276.55
That’s just a 1.33-point decline from the 52nd-bar value, followed by a flat 24,276.55 for the next 3 projected bars.
So the long-term equilibrium has sloped upward and now stabilized around 24,277.
Takeaway: 52W upward-sloping Span B + overlapping 26W/9W extremes + compressed price structure = equilibrium compression waiting for release.
Four weekly candles have now printed after the T/K intersection:
• Bearish T/K cross hasn't got activated
• Kijun-Sen has turned flat
• Chikou is moving toward past-price congestion
• Price has respected the trajectory TL, bouncing from it over the last 4 weeks
So the story has evolved:
Bearish → Neutral → Bullish Lean
But the Kangaroo still holds the key.
Above 23,495 → Bulls strengthen.
Below 22,217 → Bullish thesis weakens.
For now, Bears are loosening their grip.
Bulls are seeing light at the end of the tunnel. Can they come out of the tunnel too?
🔴 Part 1 — Kumo Breakdown + Kihon Suchi
Bears strengthened at every Kihon Suchi Simple Number Bar (9, 17, 26), with the 33rd Composite Number Bar next in focus.
⚪ Part 2 — The Magical Range
The 33rd week printed a Bullish Harami instead of bearish continuation, leading us to map the Bulls, Bears & Kangaroo territorial ranges.
Now, let’s dissect the T/K intersection to see if the bullish case has further evidence.
Ichimoku’s 9, 26 & 52 are not arbitrary — they represent short-, medium- and long-term equilibrium horizons.
Taking the T/K intersection candle as Bar 1, we look backward and construct fixed High/Low rectangles:
🔹 9W → short-term equilibrium
🔹 26W → medium-term equilibrium
🔹 52W → long-term structural stability equilibrium
We also draw a diagonal trajectory from the T/K intersection candle Low toward projected Span B at +26 periods — a trajectory hypothesis, not conventional support.
And the geometry gets interesting.
9W & 26W: 24,744.30 – 22,217.30
52W: 26,373.20 – 22,182.55
The downside boundaries are tightly clustered at 22,217–22,183.
Span B evolves:
23,779.40 → 24,277.88 → 24,276.55
That’s just a 1.33-point decline from the 52nd-bar value, followed by a flat 24,276.55 for the next 3 projected bars.
So the long-term equilibrium has sloped upward and now stabilized around 24,277.
Takeaway: 52W upward-sloping Span B + overlapping 26W/9W extremes + compressed price structure = equilibrium compression waiting for release.
Four weekly candles have now printed after the T/K intersection:
• Bearish T/K cross hasn't got activated
• Kijun-Sen has turned flat
• Chikou is moving toward past-price congestion
• Price has respected the trajectory TL, bouncing from it over the last 4 weeks
So the story has evolved:
Bearish → Neutral → Bullish Lean
But the Kangaroo still holds the key.
Above 23,495 → Bulls strengthen.
Below 22,217 → Bullish thesis weakens.
For now, Bears are loosening their grip.
Bulls are seeing light at the end of the tunnel. Can they come out of the tunnel too?

Related publications
Disclaimer
The information and publications are not meant to be, and do not constitute, financial, investment, trading, or other types of advice or recommendations supplied or endorsed by TradingView. Read more in the Terms of Use.
Related publications
Disclaimer
The information and publications are not meant to be, and do not constitute, financial, investment, trading, or other types of advice or recommendations supplied or endorsed by TradingView. Read more in the Terms of Use.