
Overview
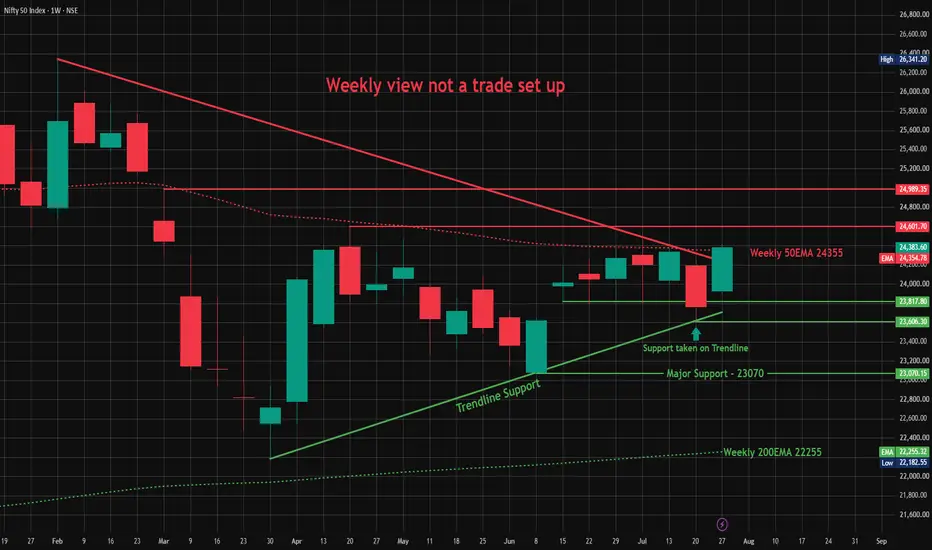
Nifty closed the week at 24,383.60, up 616 points or 2.59%. The index made a strong move this week, closing well above last week's high and staying above the weekly 50 EMA at 24,354.78. Price is now sitting right at the descending resistance line that has been capping every rally since February.
Pattern Explanation
If we look at the chart, Nifty has been respecting a rising trendline since late March, with each dip getting bought around that line. A couple of weeks back, we saw a clear bounce off this trendline support near 23,817, and since then the index has been climbing steadily with mostly green weekly candles.
At the same time, there's a falling trendline connecting the highs from February. This is the resistance we're watching closely right now. Nifty has tested this line multiple times over the last few weeks without a clean breakout.
Key Levels
Resistance 1: 24,601.70
Resistance 2 (falling trendline + horizontal): 24,989.35
Support 1: 23,817.80
Major Support: 23,070.15
Weekly 50 EMA: 24,354.78 (acting as support this week)
Weekly 200 EMA: 22,255.32 (far below, confirms long-term uptrend intact)
Scenarios
If Nifty closes above 24,989, it would confirm a breakout from the falling trendline, and we could see a move towards fresh highs.
If Nifty fails here and slips back below 24,354 (the 50 EMA), we may see another test of the rising trendline support near 23,800–23,900 before any further upside attempt.
Beginner's Lesson
A rising trendline connects higher lows and shows buyers are stepping in at progressively higher prices — that's a sign of strength. A falling trendline connects lower highs and shows sellers are capping every rally — that's resistance.
When a stock or index is sandwiched between one of each (like Nifty is right now), traders call it a "triangle" or "wedge" type setup. The breakout, whichever side it happens on, usually tells us the next big directional move. Until then, it's best to wait rather than guess.
Conclusion
Nifty is holding its rising trendline structure well, but the falling trendline resistance is the real test right now. A close above 24,989 would be the confirmation bulls are looking for. Until then, this remains a level-to-level market.
This is for educational purposes only and not investment advice. Please do your own research or consult a financial advisor before making any trading decisions.
Nifty closed the week at 24,383.60, up 616 points or 2.59%. The index made a strong move this week, closing well above last week's high and staying above the weekly 50 EMA at 24,354.78. Price is now sitting right at the descending resistance line that has been capping every rally since February.
Pattern Explanation
If we look at the chart, Nifty has been respecting a rising trendline since late March, with each dip getting bought around that line. A couple of weeks back, we saw a clear bounce off this trendline support near 23,817, and since then the index has been climbing steadily with mostly green weekly candles.
At the same time, there's a falling trendline connecting the highs from February. This is the resistance we're watching closely right now. Nifty has tested this line multiple times over the last few weeks without a clean breakout.
Key Levels
Resistance 1: 24,601.70
Resistance 2 (falling trendline + horizontal): 24,989.35
Support 1: 23,817.80
Major Support: 23,070.15
Weekly 50 EMA: 24,354.78 (acting as support this week)
Weekly 200 EMA: 22,255.32 (far below, confirms long-term uptrend intact)
Scenarios
If Nifty closes above 24,989, it would confirm a breakout from the falling trendline, and we could see a move towards fresh highs.
If Nifty fails here and slips back below 24,354 (the 50 EMA), we may see another test of the rising trendline support near 23,800–23,900 before any further upside attempt.
Beginner's Lesson
A rising trendline connects higher lows and shows buyers are stepping in at progressively higher prices — that's a sign of strength. A falling trendline connects lower highs and shows sellers are capping every rally — that's resistance.
When a stock or index is sandwiched between one of each (like Nifty is right now), traders call it a "triangle" or "wedge" type setup. The breakout, whichever side it happens on, usually tells us the next big directional move. Until then, it's best to wait rather than guess.
Conclusion
Nifty is holding its rising trendline structure well, but the falling trendline resistance is the real test right now. A close above 24,989 would be the confirmation bulls are looking for. Until then, this remains a level-to-level market.
This is for educational purposes only and not investment advice. Please do your own research or consult a financial advisor before making any trading decisions.

📈 HK Trading Community | Market Structure & Indicator Updates
Telegram: t.me/trendstrike1000
Website: quantumedgepro.netlify.app/
Real traders are built through learning,not tip hunting.So Start Learning How the Market Really Works
Telegram: t.me/trendstrike1000
Website: quantumedgepro.netlify.app/
Real traders are built through learning,not tip hunting.So Start Learning How the Market Really Works
Related publications
Disclaimer
The information and publications are not meant to be, and do not constitute, financial, investment, trading, or other types of advice or recommendations supplied or endorsed by TradingView. Read more in the Terms of Use.
📈 HK Trading Community | Market Structure & Indicator Updates
Telegram: t.me/trendstrike1000
Website: quantumedgepro.netlify.app/
Real traders are built through learning,not tip hunting.So Start Learning How the Market Really Works
Telegram: t.me/trendstrike1000
Website: quantumedgepro.netlify.app/
Real traders are built through learning,not tip hunting.So Start Learning How the Market Really Works
Related publications
Disclaimer
The information and publications are not meant to be, and do not constitute, financial, investment, trading, or other types of advice or recommendations supplied or endorsed by TradingView. Read more in the Terms of Use.