
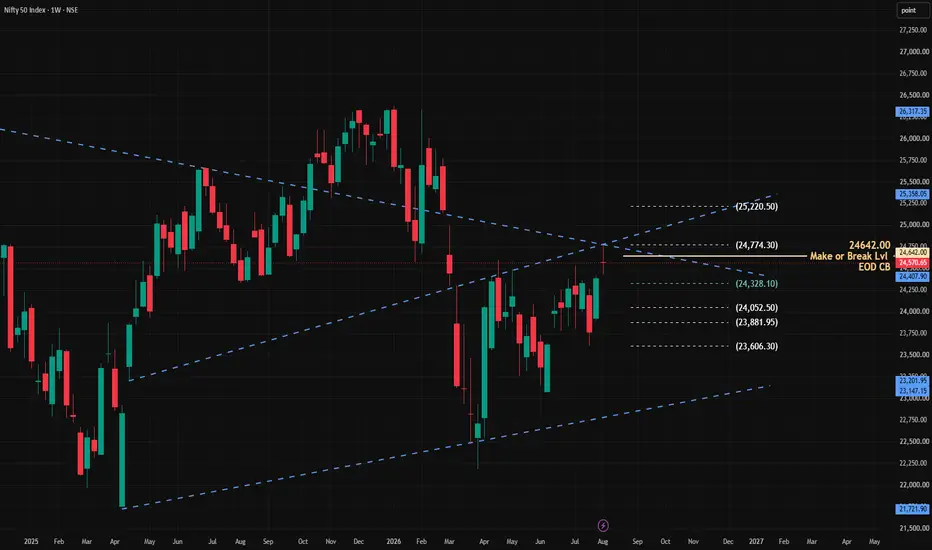
The price recently suffered a severe bearish flush that aggressively broke through the primary ascending trendline.
This liquidation spike found precise historical support at the secondary lower channel line near 21,721.90.
Following this exhaustion bottom, a strong V-shaped recovery materialized, driving the price back inside the primary structure. This rapid reclaim invalidates the initial breakdown, identifying it as a textbook "bear trap" designed to wash out leveraged longs.
Local Trajectory & Key LevelsCurrently, the asset is experiencing a short-term bullish consolidation, pressing upward toward the apex of the larger triangle structure.
The immediate price is hovering near 24,570.65, showing a minor localized retracement after testing the overhead resistance cluster.
To sustain this upward momentum, buyers must secure a clean breakout above the macro descending resistance line, currently intersecting around 24,774.30 and 25,220.50. Failure to clear this upper boundary will likely trigger a rejection, sending the price back down to retest the localized horizontal support levels mapped between 24,328.10 and 23,606.30.
For the week Aug 10-14 (2026)
24642.00 will be KEY MAKE or BREAK LEVEL.
Like Share and Follow
This liquidation spike found precise historical support at the secondary lower channel line near 21,721.90.
Following this exhaustion bottom, a strong V-shaped recovery materialized, driving the price back inside the primary structure. This rapid reclaim invalidates the initial breakdown, identifying it as a textbook "bear trap" designed to wash out leveraged longs.
Local Trajectory & Key LevelsCurrently, the asset is experiencing a short-term bullish consolidation, pressing upward toward the apex of the larger triangle structure.
The immediate price is hovering near 24,570.65, showing a minor localized retracement after testing the overhead resistance cluster.
To sustain this upward momentum, buyers must secure a clean breakout above the macro descending resistance line, currently intersecting around 24,774.30 and 25,220.50. Failure to clear this upper boundary will likely trigger a rejection, sending the price back down to retest the localized horizontal support levels mapped between 24,328.10 and 23,606.30.
For the week Aug 10-14 (2026)
24642.00 will be KEY MAKE or BREAK LEVEL.
Like Share and Follow

Related publications
Disclaimer
The information and publications are not meant to be, and do not constitute, financial, investment, trading, or other types of advice or recommendations supplied or endorsed by TradingView. Read more in the Terms of Use.
Related publications
Disclaimer
The information and publications are not meant to be, and do not constitute, financial, investment, trading, or other types of advice or recommendations supplied or endorsed by TradingView. Read more in the Terms of Use.