
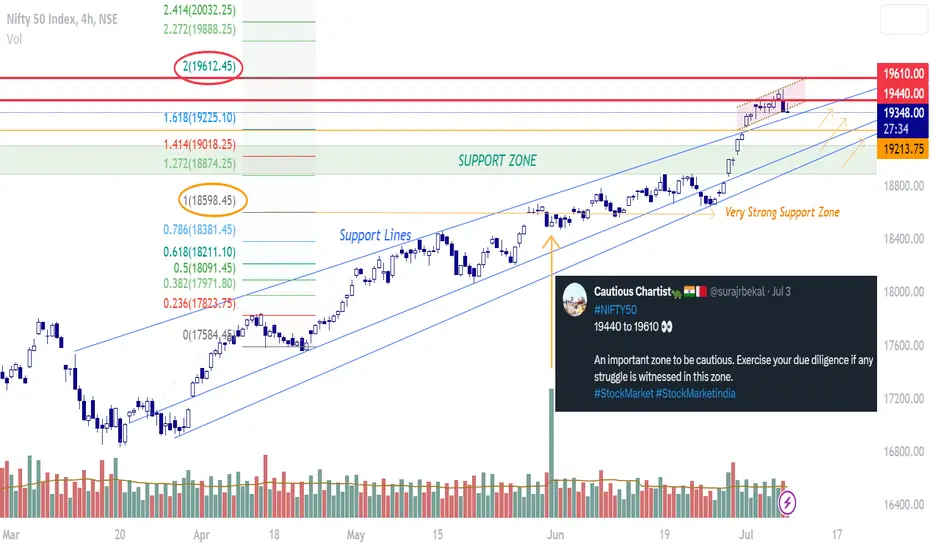
The blue lines indicate the strong trendlines where the price could take support.
As all can see, the chart has respected most of the Fibonacci levels very well including the strong 1, 1.618 and 2.
My expectation of the short term reversal zone was from the upper half of the 1.618 to 2 zone. Expect some correction next fortnight but it should be a good chance to look for accumulating quality stocks.
As all can see, the chart has respected most of the Fibonacci levels very well including the strong 1, 1.618 and 2.
My expectation of the short term reversal zone was from the upper half of the 1.618 to 2 zone. Expect some correction next fortnight but it should be a good chance to look for accumulating quality stocks.
Note

Disclaimer
The information and publications are not meant to be, and do not constitute, financial, investment, trading, or other types of advice or recommendations supplied or endorsed by TradingView. Read more in the Terms of Use.
Disclaimer
The information and publications are not meant to be, and do not constitute, financial, investment, trading, or other types of advice or recommendations supplied or endorsed by TradingView. Read more in the Terms of Use.