
Price Makes a High. Breadth Says No. Here Is How to Tell If an Index Rally Is Real or Just a Few Big Names.
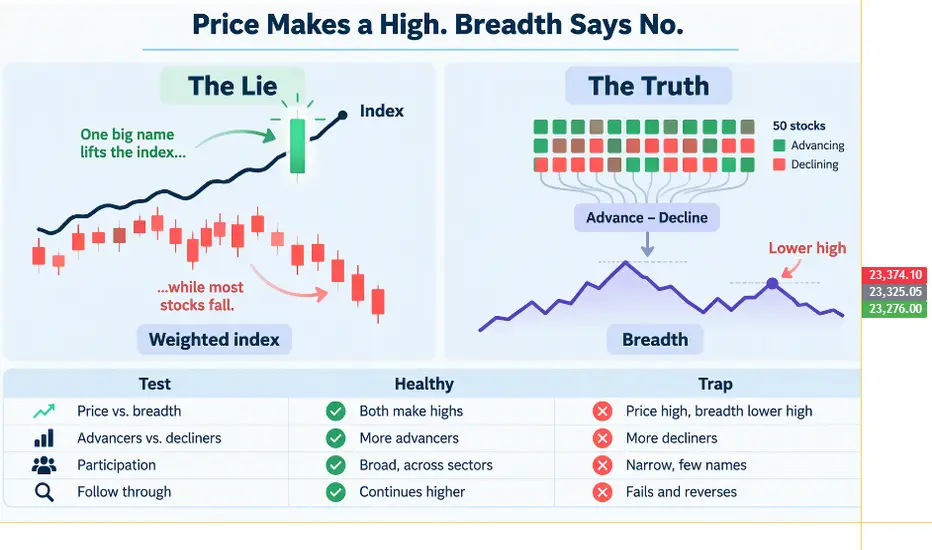
An index can hit a new high while most of its stocks are falling. This is not a trick. It is how weighted indices work.
The Nifty 50 is a free-float market-cap weighted index. That means the biggest companies carry the biggest weights, and the top 10 stocks together account for roughly half (or more) of the index.
So a handful of heavyweights rising can lift the entire index — even while the majority of the 50 stocks are flat or falling. The index candle says "bull market". The average stock says "something is wrong".
This is why serious traders do not look at price alone. They look at breadth.
What Is Market Breadth?
Breadth measures how many stocks are participating in a move. The simplest version is the Advance–Decline (A/D) data: how many stocks closed higher versus lower on the day. Accumulate that daily difference over time and you get the A/D line.
The 4 Breadth Tests
Important Honesty Check
A breadth divergence is a warning, not a timing tool. Narrow rallies can continue for weeks or even months. Divergences also resolve in both directions — sometimes breadth catches up and confirms the move.
Use breadth to answer one question: "Is this move healthy or fragile?" A healthy move deserves trust. A fragile one deserves tighter risk management.
Your turn: Which breadth tool do you trust the most — the A/D line, or the percentage of stocks above the 200-day average? Comment below.
Educational content only. Not investment advice. Market data changes frequently — please verify the latest figures independently before acting.
An index can hit a new high while most of its stocks are falling. This is not a trick. It is how weighted indices work.
The Nifty 50 is a free-float market-cap weighted index. That means the biggest companies carry the biggest weights, and the top 10 stocks together account for roughly half (or more) of the index.
So a handful of heavyweights rising can lift the entire index — even while the majority of the 50 stocks are flat or falling. The index candle says "bull market". The average stock says "something is wrong".
This is why serious traders do not look at price alone. They look at breadth.
What Is Market Breadth?
Breadth measures how many stocks are participating in a move. The simplest version is the Advance–Decline (A/D) data: how many stocks closed higher versus lower on the day. Accumulate that daily difference over time and you get the A/D line.
The 4 Breadth Tests
- 1. Price vs breadth: Healthy = both make new highs together. Warning = price makes a new high while breadth makes a lower high. This is a negative divergence.
- 2. Advancers vs decliners: Healthy = more advancers than decliners on up days. Warning = index up, but decliners outnumber advancers.
- 3. Participation: Healthy = gains spread across many sectors. Warning = a narrow rally led by two or three sectors or a few stocks.
- 4. Follow-through: Healthy = the move continues higher over following sessions. Warning = it stalls, fails and reverses.
Important Honesty Check
A breadth divergence is a warning, not a timing tool. Narrow rallies can continue for weeks or even months. Divergences also resolve in both directions — sometimes breadth catches up and confirms the move.
Use breadth to answer one question: "Is this move healthy or fragile?" A healthy move deserves trust. A fragile one deserves tighter risk management.
Index = the headline. Breadth = the story underneath.
Your turn: Which breadth tool do you trust the most — the A/D line, or the percentage of stocks above the 200-day average? Comment below.
Educational content only. Not investment advice. Market data changes frequently — please verify the latest figures independently before acting.
Note
Simple Ways to Measure Breadth on TradingView1. Advance–Decline line for your index or exchange
2. Percentage of index stocks trading above their 50-day and 200-day moving averages
3. Compare the regular Nifty 50 with the Nifty 50 Equal Weight index, or with a broader index such as the Nifty 500. If the broader or equal-weight version lags badly while the Nifty 50 makes highs, the rally is narrow.

Disclaimer
The information and publications are not meant to be, and do not constitute, financial, investment, trading, or other types of advice or recommendations supplied or endorsed by TradingView. Read more in the Terms of Use.
Disclaimer
The information and publications are not meant to be, and do not constitute, financial, investment, trading, or other types of advice or recommendations supplied or endorsed by TradingView. Read more in the Terms of Use.