
📊
📅 15-Min Chart Analysis | Post Expiry Week | Educational Purpose Only
⚠️ Chart Colour Guide — Read Before Proceeding:
🟠 Orange Line/Zone = No Trade Zone / Sideways / Wait & Watch
🟢 Green Line/Zone = Bullish Bias / Long Setup
🔴 Red Line/Zone = Bearish Bias / Short Setup
- - - Dashed Lines = Probable price path — may or may not play out — always wait for confirmation
📜 PART 1 — YESTERDAY'S REVIEW (08-Jul-2026)
🔍 Actual Price Movement vs Our Plan
📌 What Our Plan Said for 08-Jul:
🔵 Main Pivot Zone: 24,348 – 24,372 (Orange Zone)
🔵 Bearish below 24,372 → Targets: 24,311 → 24,196 → 24,096
🔵 Recovery only above 24,439+
📊 What Actually Happened on 08-Jul-2026:
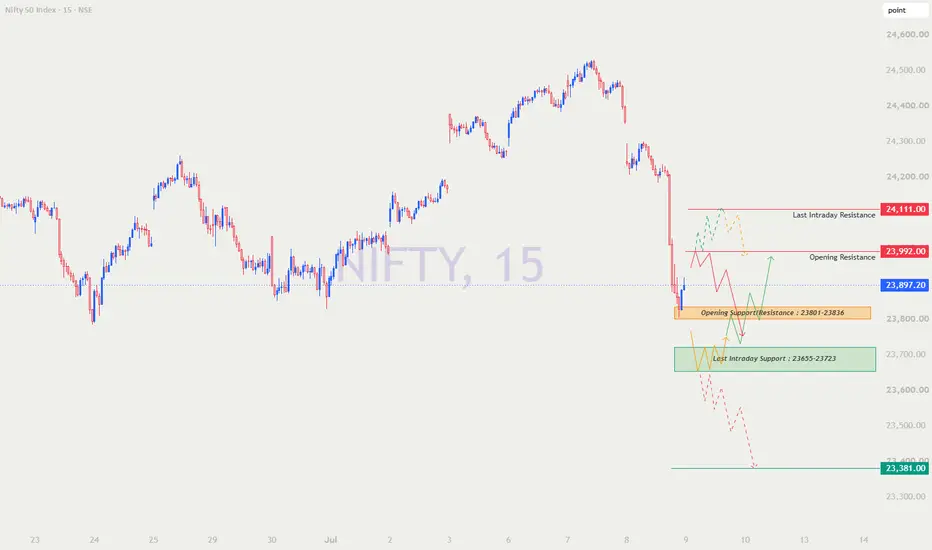
Looking at today's chart clearly tells the story 👇
🔴 Market opened and immediately showed massive selling pressure
🔴 A sharp gap down / breakdown occurred — price collapsed from 24,355 area
🔴 Market fell aggressively through ALL support levels:
→ ❌ 24,311 support — BROKEN
→ ❌ 24,196 Buyer's support — BROKEN
→ ❌ 24,096 extended target — BROKEN & EXCEEDED
🔴 Nifty closed at 23,897.20 — up just +13.80 pts after recovering from day's lows
🔴 Intraday low touched near 23,882 — a massive ~450+ point crash from previous close!
🔴 The bearish dashed path on yesterday's chart played out — and then some! 📉
✅ Plan Accuracy Review for 08-Jul:
🎯 Bearish bias → ✅ CORRECT — Market fell heavily
🎯 Below 24,372 = Bears win → ✅ PERFECTLY CALLED
🎯 24,311 breakdown → ✅ Broken convincingly
🎯 24,196 Buyer's support → ✅ Broken — no bounce sustained
🎯 24,096 Extended target → ✅ Hit and exceeded
🎯 Dashed bearish path → ✅ Played out aggressively
💡 Key Learning from 08-Jul:
🔵 When all supports break on high momentum — don't try to catch the falling knife
🔵 The orange no-trade zone saved traders from being trapped long
🔵 Bears were in complete control — respecting the breakdown gave clean short trades
🔵 Never fight the trend — when bearish plan activates, ride it with trailing SL
🔵 Today's close at 23,897 sets up a completely fresh battle zone for tomorrow
"The market fell 450 points in a single session — those who had a plan survived. Those who didn't — paid the price." 📖
🔑 KEY LEVELS FOR 09-JUL-2026
text
🔴 Last Intraday Resistance → 24,111
🔴 Opening Resistance → 23,992
🟠 CMP / Reference → 23,897.20
🟠 Opening Support/Resistance → 23,801 – 23,836 ← MAIN PIVOT ZONE ⚡
🟢 Last Intraday Support → 23,655 – 23,723 ← KEY SUPPORT ZONE
🟢 Extended Bear Target → 23,381 ← MAJOR SUPPORT (Green Line)
💡 09-Jul-2026 Market Context:
🔵 Yesterday saw a massive 450+ point single-day collapse
🔵 Market closed at 23,897 — deep in bearish territory
🔵 The orange pivot zone 23,801–23,836 is now the most critical battleground
🔵 Any recovery attempt will face strong resistance at 23,992 and 24,111
🔵 Below 23,801 → Fresh selling wave possible toward 23,655–23,723
🔵 Global cues, FII activity and SGX Nifty will be crucial tomorrow morning
🔵 Volatility will remain elevated — position sizing is critical!
🚀 SCENARIO 1 — GAP UP OPENING (100+ Points Above Previous Close)
📍 Expected Opening Range: Above 23,997 (i.e., 23,897 + 100)
📖 Understanding The Gap Up Setup:
A Gap Up of 100+ points after yesterday's massive 450-point crash would open the market right near or above the 23,992 Opening Resistance zone (red line on chart). This kind of recovery gap after a panic selloff is called a Dead Cat Bounce Gap or Short Covering Gap.
Why is this important to understand? 🧠
🔸 After extreme single-day falls, markets often gap up next morning due to:
→ Overnight short covering by bears
→ Positive global markets recovery
→ Bargain hunting by institutions
→ SGX Nifty recovery overnight
🔸 However — gap ups after panic falls are often unreliable and trap-prone
🔸 The real question is: Can bulls sustain the gap or will sellers dump into the recovery?
🔸 Key resistance levels 23,992 and 24,111 will be the ultimate test for bulls
This is a critical scenario — patience is non-negotiable here. ⏳
📋 TRADE PLAN — GAP UP OPENING:
⏳ First 15 Minutes Rule:
After a major crash day, never trade the opening candle. Let at least the first 15-min candle complete. Observe volume and direction carefully.
🟢 BULLISH PLAN — Long Setup (Gap Up Sustains Above 23,992):
🔵 Setup: Market gaps up to 23,992+ zone and sustains above it with a strong 15-min candle close. This indicates genuine buying interest and possible short-term trend reversal.
🔵 Entry Trigger: Buy above 24,000 (psychological + technical level)
🔵 Target 1: 24,060
🔵 Target 2: 24,111 🎯 (Last Intraday Resistance — Red Line on Chart)
🔵 Target 3: 24,180 (if momentum is very strong — extended recovery)
🔵 Stop Loss: Below 23,960 (back below opening resistance = bull trap signal)
📌 Options Strategy (Educational):
Buy 24,000 CE or 24,100 CE on confirmed sustain above 23,992
⚡ After a crash day, CE premiums will be elevated due to high IV — buy smaller quantity
⚡ Book 50% at T1 — don't be greedy after a recovery bounce
⚡ Use next week expiry options — not current week (more time value)
🔴 BEARISH PLAN — Short Setup (Gap Up Fails / Selling Into Recovery):
🔵 Setup: Market gaps up near 23,992 but fails to sustain. Sellers aggressively dump into the recovery — classic "sell the bounce" behaviour after a crash. Bearish engulfing or shooting star on 15-min confirms the rejection.
🔵 Entry Trigger: Short below 23,950 (confirmed fade from opening resistance)
🔵 Target 1: 23,897 (previous close — gap fill)
🔵 Target 2: 23,836 (upper boundary of orange pivot zone)
🔵 Target 3: 23,801 🎯 (lower boundary of orange pivot zone)
🔵 Target 4: 23,723 – 23,655 🎯 (Last Intraday Support Zone — green zone)
🔵 Stop Loss: Above 23,992 (back above opening resistance = short plan invalid)
📌 Options Strategy (Educational):
Buy 23,900 PE or 23,800 PE on confirmed rejection and fade
⚡ "Sell the bounce" trades after crash days are high-probability — but require patience
⚡ Don't short blindly into a gap up — wait for confirmed rejection candle first
🟠 NO TRADE ZONE (Gap Up Scenario):
Market opens gap up and oscillates between 23,960 – 23,992 = Pure confusion zone ⛔
🔵 Neither bulls nor bears have conviction
🔵 Both CE and PE will bleed in this choppy range
🔵 Best action = Hands in pocket. Watch. Wait.
"After a 450-point crash, a gap up recovery seems exciting — but the first move is often the wrong move. Let the market prove its intent before you commit capital." 🎯
➡️ SCENARIO 2 — FLAT OPENING (Within ±50 Points of Previous Close)
📍 Expected Opening Range: 23,847 – 23,947 (Near 23,897 Close)
📖 Understanding The Flat Opening Setup:
A flat opening near yesterday's close of 23,897 is actually the most dangerous scenario for the day after a massive crash. Here's why:
🔸 Market opens flat = uncertainty and indecision after a panic day
🔸 The opening places market just above the orange pivot zone (23,801–23,836)
🔸 Bulls will try to recover — bears will try to continue the selloff
🔸 The orange zone below is like a trapdoor — if it breaks, another big leg down begins
🔸 The resistance above at 23,992 and 24,111 are heavy ceilings for bulls
The orange pivot zone 23,801–23,836 is your most critical level in this scenario.
Everything depends on whether this zone holds or breaks.
📋 TRADE PLAN — FLAT OPENING:
⏳ Extended Wait — First 30 Minutes:
Flat open after a crash = Maximum indecision. Give the market at least 30 minutes to establish direction. The opening range (first 30-min high-low) becomes your trading reference.
🟢 BULLISH PLAN — Long Setup (Flat Open, Recovery Attempt):
🔵 Setup: Market opens flat near 23,897. Shows early stability and starts recovering. Price breaks and sustains above 23,950 with good volume — indicating short covering and fresh buying.
🔵 Entry Trigger: Buy above 23,960 (confirmed recovery above opening range)
🔵 Target 1: 23,992 (Opening Resistance — Red Line)
🔵 Target 2: 24,060
🔵 Target 3: 24,111 🎯 (Last Intraday Resistance — major target for bulls)
🔵 Stop Loss: Below 23,836 (break of orange pivot zone upper boundary = plan fails)
📌 Options Strategy (Educational):
Buy 23,950 CE or 24,000 CE on confirmed breakout above 23,960
⚡ After crash days, IV remains high — premiums are expensive. Adjust lot size accordingly.
⚡ Trail SL to cost once T1 is achieved — protect capital first, profit second.
🔴 BEARISH PLAN — Short Setup (Flat Open, Continuation of Selling):
🔵 Setup: Market opens flat but immediately shows weakness. Unable to sustain above 23,897. Early signs of fresh selling — lower highs forming. Break below 23,801 (lower boundary of orange pivot zone) confirms continuation of yesterday's downtrend.
🔵 Entry Trigger: Short below 23,800 (confirmed breakdown below orange pivot zone)
🔵 Target 1: 23,723 (upper boundary of Last Intraday Support — green zone)
🔵 Target 2: 23,655 🎯 (lower boundary of Last Intraday Support — green zone)
🔵 Target 3: 23,500 (intermediate level)
🔵 Target 4: 23,381 🎯 (Extended Bear Target — Major Green Support Line)
🔵 Stop Loss: Above 23,850 (back inside orange zone = bearish plan invalid)
📌 Options Strategy (Educational):
Buy 23,800 PE or 23,700 PE on confirmed breakdown below 23,800
⚡ This is a trend continuation trade — if it activates, it can give 200-300 point move
⚡ Book 40% at T1, 40% at T2, trail remaining 20% for T3/T4 with candle SL
⚡ Don't average if trade goes against you — cut and wait for re-entry
🟠 NO TRADE ZONE (Flat Open):
Market oscillating between 23,801 – 23,960 after flat open = Complete orange zone ⛔
🔵 This is maximum confusion territory
🔵 After a crash day, this range is filled with:
→ Trapped longs trying to exit
→ Bears booking profits
→ Fresh buyers testing the water
→ All creating choppy, directionless price action
🔵 Both CE and PE buyers will lose in this chop
✅ Only strategy viable here = Wait and watch
"The day after a crash is not the day to be a hero. It is the day to be a student — observe, analyze, then act with precision." 🧘
💡 Flat Open Key Insight for 09-Jul:
The 23,801 – 23,836 orange zone is the gatekeeper between recovery and further collapse. Bulls must defend this zone aggressively. If they fail — the road to 23,381 opens up. This is a make-or-break level for tomorrow. 🔑
📉 SCENARIO 3 — GAP DOWN OPENING (100+ Points Below Previous Close)
📍 Expected Opening Range: Below 23,797 (i.e., 23,897 - 100)
📖 Understanding The Gap Down Setup:
A Gap Down of 100+ points after yesterday's already massive crash would be an extreme bearish signal. This would open the market directly inside or below the orange pivot zone of 23,801–23,836 — and potentially threaten the 23,655–23,723 Last Intraday Support Zone immediately.
This scenario would mean:
🔸 Two consecutive heavy bearish sessions — rare but powerful signal
🔸 Likely driven by extremely negative global overnight cues
🔸 Possible circuit breaker territory if selling is extreme
🔸 Panic selling will be maximum — emotional decisions will destroy accounts
Two key questions in this scenario:
1️⃣ Does the market find support at 23,655–23,723? (Green zone — Last Intraday Support)
2️⃣ Or does it collapse all the way to 23,381? (Major Green Support — Extended Target)
Rule #1 in gap down after crash = DO NOT PANIC SELL THE LOWS 🚫
📋 TRADE PLAN — GAP DOWN OPENING:
⏳ Maximum Patience Required:
After gap down following a crash day — wait for minimum 15-20 minutes. Let the opening panic exhaust itself. Look for:
✅ Selling climax (massive red candle followed by sharp recovery) = Bounce signal
✅ Sustained lower highs on recovery attempts = Continuation signal
🟢 BULLISH PLAN — Bounce/Long Setup (Gap Down Support Hold):
🔵 Setup: Market gaps down but finds strong support at 23,655–23,723 (Last Intraday Support — green zone on chart). Bullish reversal candle forms — hammer, doji, or engulfing. Institutional buying visible.
🔵 Entry Trigger: Buy above 23,730 (confirmed bounce above support zone)
🔵 Target 1: 23,836 (upper boundary of orange pivot zone)
🔵 Target 2: 23,897 (previous close — full gap fill)
🔵 Target 3: 23,992 🎯 (Opening resistance — strong recovery target)
🔵 Stop Loss: Below 23,640 (below Last Intraday Support zone = no bounce)
📌 Options Strategy (Educational):
Buy 23,750 CE or 23,800 CE on confirmed bounce above 23,730
⚡ Bounce trades from major support zones = High reward potential
⚡ But in two consecutive crash scenarios — keep lot size at minimum (1 lot only)
⚡ Book 50% profit at T1 without fail — don't let a winning bounce trade turn into a loser
🔴 BEARISH PLAN — Short Setup / Continuation (Gap Down, Support Breaks):
🔵 Setup: Market gaps down and breaks below 23,655 (lower boundary of Last Intraday Support zone). No meaningful bounce. Panic selling continues. This is the most extreme bearish scenario.
🔵 Entry Trigger: Short below 23,640 (confirmed breakdown of all support)
🔵 Target 1: 23,500
🔵 Target 2: 23,381 🎯 (Extended Bear Target — Major Green Support Line on Chart)
🔵 Target 3: 23,250 (if 23,381 also breaks — extreme panic scenario)
🔵 Stop Loss: Above 23,730 (back inside support zone = short plan invalid)
📌 Options Strategy (Educational):
Buy 23,600 PE or 23,400 PE on confirmed breakdown below 23,640
⚡ In extreme breakdown scenarios — DO NOT buy deep OTM puts in panic
⚡ Near-the-money strikes only — better delta and response
⚡ Keep position size very small — volatility can reverse sharply at any point
🟠 NO TRADE ZONE (Gap Down Scenario):
Market gaps down and oscillates between 23,640 – 23,730 = Confusion zone ⛔
🔵 Support is being tested but not yet broken
🔵 Both bounce and breakdown are possible
🔵 This is the most dangerous zone to be in — maximum whipsaw risk
🔵 Best action = Do absolutely nothing. Watch only.
"Two consecutive crash days demand maximum respect and minimum action. The market is volatile, emotional and unpredictable. Your discipline in NOT trading is your biggest edge here." 💪
💡 Gap Down Emergency Tip for 09-Jul:
If market gaps down heavily and 23,381 is approached directly — this is a MAJOR long-term support on higher timeframes. Extreme panic selling into this zone historically provides excellent bounce opportunities — but only for experienced traders with defined risk. Beginners should simply watch and learn. 📚
🛡️ RISK MANAGEMENT TIPS FOR OPTIONS TRADING
(After a 450-Point Crash Day — These Tips Are More Important Than Ever)
📌 Tip 1 — Reduce Position Size After Volatile Days:
🔵 Yesterday's 450-point crash means IV (Implied Volatility) is elevated today
🔵 High IV = Expensive option premiums = Higher risk for buyers
🔵 Solution: Trade half your normal lot size until market stabilizes
🔵 This protects your capital while still allowing participation
📌 Tip 2 — The Bounce Trade Golden Rule:
🔵 After a massive crash, bounces look tempting
🔵 But "dead cat bounces" are common — they go up briefly then crash again
🔵 Rule: Take only 50% of your normal profit target on bounce trades after crash days
🔵 Don't expect a V-shape recovery immediately — it rarely happens
📌 Tip 3 — Never Average Down on Options:
🔵 If your CE is losing after a crash — DO NOT BUY MORE
🔵 Options lose value exponentially as they go OTM
🔵 Averaging options = Multiplying your losses, not reducing them
🔵 Cut, reassess, re-enter fresh if setup confirms
📌 Tip 4 — The 30-40% Premium Stop Loss Rule:
🔵 Entry CE at ₹100 → Exit compulsorily at ₹65 (35% SL)
🔵 Entry PE at ₹80 → Exit compulsorily at ₹52 (35% SL)
🔵 Set this as a mental rule before every entry — not after loss starts
🔵 This single rule saves most retail traders from account blow-ups ✅
📌 Tip 5 — High Volatility = Wider Stops, Smaller Size:
🔵 After a crash, market swings are wider than normal
🔵 Normal 20-point SL may not work — market can swing 50-80 points easily
🔵 Solution: Wider SL + Proportionally smaller position size = Same risk
🔵 Example: Normal trade = 2 lots, 25-pt SL → Post-crash = 1 lot, 50-pt SL
📌 Tip 6 — Avoid Overtrading on High Volatility Days:
🔵 High volatility = More signals = More temptation to trade
🔵 But more trades ≠ More profits
🔵 After a crash day — limit yourself to maximum 2 trades for the entire day
🔵 Quality over quantity. Always. 🎯
📌 Tip 7 — Pre-Market Checklist for 09-Jul:
🔵 Check Gift Nifty / SGX Nifty at 8:00 AM — gap indicator
🔵 Check US Markets (Dow, S&P, Nasdaq) — did they recover or fall further?
🔵 Check Asia Markets at 9:00 AM (Nikkei, Hang Seng, Kospi)
🔵 Check FII/DII data from 08-Jul (available on NSE website)
🔵 Check any major news/events — budget, RBI, global macro
🔵 This 15-minute homework = Your market bias compass 🧭
📝 SUMMARY & CONCLUSION
📊 08-Jul Recap in Brief:
🔴 Massive 450+ point single session crash
🔴 All planned support levels broken
🔴 Bearish dashed path played out completely
🔴 Closed at 23,897 — setting up a fresh battle zone
💡 Key learning: When trend is strong, don't fight it — ride it with SL ✅
📊 09-Jul Complete Level Reference Table:
Zone Level Type Action
🔴 Last Intraday Resistance 24,111 Red Line Strong Sell/Short Zone
🔴 Opening Resistance 23,992 Red Line Sell/Resistance Zone
🟠 CMP Reference 23,897 Blue Current Price
🟠 Main Pivot Zone 23,801 – 23,836 Orange Decision Zone — No Trade
🟢 Last Intraday Support 23,655 – 23,723 Green Zone Buy/Long Zone
🟢 Extended Bear Target 23,381 Green Line Major Support / Bear Target
🎯 Overall Bias for 09-Jul-2026:
📌 Short-term bias: STRONGLY BEARISH (after 450-pt crash close)
📌 Recovery possible ONLY IF market reclaims 23,992+ convincingly
📌 Bears firmly in control below 23,836
📌 Dashed lines on chart show two probable paths:
→ 🟢 Recovery dashed path: Bounce → 23,992 → 24,111
→ 🔴 Continuation dashed path: Break → 23,723 → 23,655 → 23,381
Key message: Respect the levels. Respect the trend. Don't be a hero. 🎯
🌟 Final Takeaways:
🔵 Orange zone 23,801–23,836 = Most critical zone tomorrow
🔵 Above orange zone + sustain = Recovery trade toward 23,992–24,111
🔵 Below orange zone + sustain = Short trade toward 23,655–23,381
🔵 Dashed lines = Probable paths only — never trade without confirmation
🔵 Green lines = Support zones — look for bounce confirmation here
🔵 Red lines = Resistance zones — look for rejection confirmation here
🔵 After a crash day — smaller size, wider stops, fewer trades 🛡️
🔵 Capital preservation is the #1 priority after a volatile session
"The market humbles the overconfident and rewards the disciplined. After a storm, the best traders don't rush back in — they wait for the dust to settle, identify the new levels, and then act with precision." 💚
"Yesterday's crash is today's lesson. Today's plan is tomorrow's edge." 🔄
⚠️ DISCLAIMER
📢 I am NOT a SEBI Registered Research Analyst or Investment Advisor.
🔴 This post is purely for educational and informational purposes only.
🔴 All levels, scenarios, trade setups and analysis shared here are based on personal technical chart reading and represent NO buy/sell recommendations of any kind.
🔴 Options and futures trading involves substantial financial risk. You can lose your entire invested capital — especially in high volatility environments like post-crash sessions.
🔴 Past accuracy of levels and plans does NOT guarantee future performance.
🔴 The market conditions described are based on chart reading only — fundamental, macroeconomic and global factors may alter price behaviour significantly.
🔴 Always consult a SEBI Registered Financial Advisor before making any investment or trading decisions.
🔴 The author holds absolutely no responsibility for any financial gains or losses arising directly or indirectly from the use of this information.
Trade Safe. Trade Smart. Protect Your Capital First. Always. 🙏
📊 Chart: Nifty 50 Index | Timeframe: 15-Min | Exchange: NSE | Source: TradingView
📅 Plan Date: 09-July-2026 | Regular Trading Session
🕗 Plan Published: Post Market Close 08-Jul-2026 | 22:32 IST
👍 If this analysis added value — Like & Follow for daily plans!
🔖 Save this post for reference during tomorrow's market hours!
💬 Drop your view below — Bullish bounce or Bearish continuation for 09-Jul?
#Nifty #Nifty50 #NiftyAnalysis #TradingPlan #StockMarketIndia #NSE #TechnicalAnalysis #OptionsTrading #NiftyOptions #DayTrading #PriceAction #ChartAnalysis #LearnTrading #TradingEducation #RiskManagement #IndianStockMarket #MarketAnalysis #TradeSetup #TradeSmart #NiftyLevels #PostCrash #MarketCrash #IndexTrading #TradingCommunity #FinanceIndia #StockMarket #TradingLife #MarketOutlook #NiftyPrediction #BearMarket
📅 15-Min Chart Analysis | Post Expiry Week | Educational Purpose Only
⚠️ Chart Colour Guide — Read Before Proceeding:
🟠 Orange Line/Zone = No Trade Zone / Sideways / Wait & Watch
🟢 Green Line/Zone = Bullish Bias / Long Setup
🔴 Red Line/Zone = Bearish Bias / Short Setup
- - - Dashed Lines = Probable price path — may or may not play out — always wait for confirmation
📜 PART 1 — YESTERDAY'S REVIEW (08-Jul-2026)
🔍 Actual Price Movement vs Our Plan
📌 What Our Plan Said for 08-Jul:
🔵 Main Pivot Zone: 24,348 – 24,372 (Orange Zone)
🔵 Bearish below 24,372 → Targets: 24,311 → 24,196 → 24,096
🔵 Recovery only above 24,439+
📊 What Actually Happened on 08-Jul-2026:
Looking at today's chart clearly tells the story 👇
🔴 Market opened and immediately showed massive selling pressure
🔴 A sharp gap down / breakdown occurred — price collapsed from 24,355 area
🔴 Market fell aggressively through ALL support levels:
→ ❌ 24,311 support — BROKEN
→ ❌ 24,196 Buyer's support — BROKEN
→ ❌ 24,096 extended target — BROKEN & EXCEEDED
🔴 Nifty closed at 23,897.20 — up just +13.80 pts after recovering from day's lows
🔴 Intraday low touched near 23,882 — a massive ~450+ point crash from previous close!
🔴 The bearish dashed path on yesterday's chart played out — and then some! 📉
✅ Plan Accuracy Review for 08-Jul:
🎯 Bearish bias → ✅ CORRECT — Market fell heavily
🎯 Below 24,372 = Bears win → ✅ PERFECTLY CALLED
🎯 24,311 breakdown → ✅ Broken convincingly
🎯 24,196 Buyer's support → ✅ Broken — no bounce sustained
🎯 24,096 Extended target → ✅ Hit and exceeded
🎯 Dashed bearish path → ✅ Played out aggressively
💡 Key Learning from 08-Jul:
🔵 When all supports break on high momentum — don't try to catch the falling knife
🔵 The orange no-trade zone saved traders from being trapped long
🔵 Bears were in complete control — respecting the breakdown gave clean short trades
🔵 Never fight the trend — when bearish plan activates, ride it with trailing SL
🔵 Today's close at 23,897 sets up a completely fresh battle zone for tomorrow
"The market fell 450 points in a single session — those who had a plan survived. Those who didn't — paid the price." 📖
🔑 KEY LEVELS FOR 09-JUL-2026
text
🔴 Last Intraday Resistance → 24,111
🔴 Opening Resistance → 23,992
🟠 CMP / Reference → 23,897.20
🟠 Opening Support/Resistance → 23,801 – 23,836 ← MAIN PIVOT ZONE ⚡
🟢 Last Intraday Support → 23,655 – 23,723 ← KEY SUPPORT ZONE
🟢 Extended Bear Target → 23,381 ← MAJOR SUPPORT (Green Line)
💡 09-Jul-2026 Market Context:
🔵 Yesterday saw a massive 450+ point single-day collapse
🔵 Market closed at 23,897 — deep in bearish territory
🔵 The orange pivot zone 23,801–23,836 is now the most critical battleground
🔵 Any recovery attempt will face strong resistance at 23,992 and 24,111
🔵 Below 23,801 → Fresh selling wave possible toward 23,655–23,723
🔵 Global cues, FII activity and SGX Nifty will be crucial tomorrow morning
🔵 Volatility will remain elevated — position sizing is critical!
🚀 SCENARIO 1 — GAP UP OPENING (100+ Points Above Previous Close)
📍 Expected Opening Range: Above 23,997 (i.e., 23,897 + 100)
📖 Understanding The Gap Up Setup:
A Gap Up of 100+ points after yesterday's massive 450-point crash would open the market right near or above the 23,992 Opening Resistance zone (red line on chart). This kind of recovery gap after a panic selloff is called a Dead Cat Bounce Gap or Short Covering Gap.
Why is this important to understand? 🧠
🔸 After extreme single-day falls, markets often gap up next morning due to:
→ Overnight short covering by bears
→ Positive global markets recovery
→ Bargain hunting by institutions
→ SGX Nifty recovery overnight
🔸 However — gap ups after panic falls are often unreliable and trap-prone
🔸 The real question is: Can bulls sustain the gap or will sellers dump into the recovery?
🔸 Key resistance levels 23,992 and 24,111 will be the ultimate test for bulls
This is a critical scenario — patience is non-negotiable here. ⏳
📋 TRADE PLAN — GAP UP OPENING:
⏳ First 15 Minutes Rule:
After a major crash day, never trade the opening candle. Let at least the first 15-min candle complete. Observe volume and direction carefully.
🟢 BULLISH PLAN — Long Setup (Gap Up Sustains Above 23,992):
🔵 Setup: Market gaps up to 23,992+ zone and sustains above it with a strong 15-min candle close. This indicates genuine buying interest and possible short-term trend reversal.
🔵 Entry Trigger: Buy above 24,000 (psychological + technical level)
🔵 Target 1: 24,060
🔵 Target 2: 24,111 🎯 (Last Intraday Resistance — Red Line on Chart)
🔵 Target 3: 24,180 (if momentum is very strong — extended recovery)
🔵 Stop Loss: Below 23,960 (back below opening resistance = bull trap signal)
📌 Options Strategy (Educational):
Buy 24,000 CE or 24,100 CE on confirmed sustain above 23,992
⚡ After a crash day, CE premiums will be elevated due to high IV — buy smaller quantity
⚡ Book 50% at T1 — don't be greedy after a recovery bounce
⚡ Use next week expiry options — not current week (more time value)
🔴 BEARISH PLAN — Short Setup (Gap Up Fails / Selling Into Recovery):
🔵 Setup: Market gaps up near 23,992 but fails to sustain. Sellers aggressively dump into the recovery — classic "sell the bounce" behaviour after a crash. Bearish engulfing or shooting star on 15-min confirms the rejection.
🔵 Entry Trigger: Short below 23,950 (confirmed fade from opening resistance)
🔵 Target 1: 23,897 (previous close — gap fill)
🔵 Target 2: 23,836 (upper boundary of orange pivot zone)
🔵 Target 3: 23,801 🎯 (lower boundary of orange pivot zone)
🔵 Target 4: 23,723 – 23,655 🎯 (Last Intraday Support Zone — green zone)
🔵 Stop Loss: Above 23,992 (back above opening resistance = short plan invalid)
📌 Options Strategy (Educational):
Buy 23,900 PE or 23,800 PE on confirmed rejection and fade
⚡ "Sell the bounce" trades after crash days are high-probability — but require patience
⚡ Don't short blindly into a gap up — wait for confirmed rejection candle first
🟠 NO TRADE ZONE (Gap Up Scenario):
Market opens gap up and oscillates between 23,960 – 23,992 = Pure confusion zone ⛔
🔵 Neither bulls nor bears have conviction
🔵 Both CE and PE will bleed in this choppy range
🔵 Best action = Hands in pocket. Watch. Wait.
"After a 450-point crash, a gap up recovery seems exciting — but the first move is often the wrong move. Let the market prove its intent before you commit capital." 🎯
➡️ SCENARIO 2 — FLAT OPENING (Within ±50 Points of Previous Close)
📍 Expected Opening Range: 23,847 – 23,947 (Near 23,897 Close)
📖 Understanding The Flat Opening Setup:
A flat opening near yesterday's close of 23,897 is actually the most dangerous scenario for the day after a massive crash. Here's why:
🔸 Market opens flat = uncertainty and indecision after a panic day
🔸 The opening places market just above the orange pivot zone (23,801–23,836)
🔸 Bulls will try to recover — bears will try to continue the selloff
🔸 The orange zone below is like a trapdoor — if it breaks, another big leg down begins
🔸 The resistance above at 23,992 and 24,111 are heavy ceilings for bulls
The orange pivot zone 23,801–23,836 is your most critical level in this scenario.
Everything depends on whether this zone holds or breaks.
📋 TRADE PLAN — FLAT OPENING:
⏳ Extended Wait — First 30 Minutes:
Flat open after a crash = Maximum indecision. Give the market at least 30 minutes to establish direction. The opening range (first 30-min high-low) becomes your trading reference.
🟢 BULLISH PLAN — Long Setup (Flat Open, Recovery Attempt):
🔵 Setup: Market opens flat near 23,897. Shows early stability and starts recovering. Price breaks and sustains above 23,950 with good volume — indicating short covering and fresh buying.
🔵 Entry Trigger: Buy above 23,960 (confirmed recovery above opening range)
🔵 Target 1: 23,992 (Opening Resistance — Red Line)
🔵 Target 2: 24,060
🔵 Target 3: 24,111 🎯 (Last Intraday Resistance — major target for bulls)
🔵 Stop Loss: Below 23,836 (break of orange pivot zone upper boundary = plan fails)
📌 Options Strategy (Educational):
Buy 23,950 CE or 24,000 CE on confirmed breakout above 23,960
⚡ After crash days, IV remains high — premiums are expensive. Adjust lot size accordingly.
⚡ Trail SL to cost once T1 is achieved — protect capital first, profit second.
🔴 BEARISH PLAN — Short Setup (Flat Open, Continuation of Selling):
🔵 Setup: Market opens flat but immediately shows weakness. Unable to sustain above 23,897. Early signs of fresh selling — lower highs forming. Break below 23,801 (lower boundary of orange pivot zone) confirms continuation of yesterday's downtrend.
🔵 Entry Trigger: Short below 23,800 (confirmed breakdown below orange pivot zone)
🔵 Target 1: 23,723 (upper boundary of Last Intraday Support — green zone)
🔵 Target 2: 23,655 🎯 (lower boundary of Last Intraday Support — green zone)
🔵 Target 3: 23,500 (intermediate level)
🔵 Target 4: 23,381 🎯 (Extended Bear Target — Major Green Support Line)
🔵 Stop Loss: Above 23,850 (back inside orange zone = bearish plan invalid)
📌 Options Strategy (Educational):
Buy 23,800 PE or 23,700 PE on confirmed breakdown below 23,800
⚡ This is a trend continuation trade — if it activates, it can give 200-300 point move
⚡ Book 40% at T1, 40% at T2, trail remaining 20% for T3/T4 with candle SL
⚡ Don't average if trade goes against you — cut and wait for re-entry
🟠 NO TRADE ZONE (Flat Open):
Market oscillating between 23,801 – 23,960 after flat open = Complete orange zone ⛔
🔵 This is maximum confusion territory
🔵 After a crash day, this range is filled with:
→ Trapped longs trying to exit
→ Bears booking profits
→ Fresh buyers testing the water
→ All creating choppy, directionless price action
🔵 Both CE and PE buyers will lose in this chop
✅ Only strategy viable here = Wait and watch
"The day after a crash is not the day to be a hero. It is the day to be a student — observe, analyze, then act with precision." 🧘
💡 Flat Open Key Insight for 09-Jul:
The 23,801 – 23,836 orange zone is the gatekeeper between recovery and further collapse. Bulls must defend this zone aggressively. If they fail — the road to 23,381 opens up. This is a make-or-break level for tomorrow. 🔑
📉 SCENARIO 3 — GAP DOWN OPENING (100+ Points Below Previous Close)
📍 Expected Opening Range: Below 23,797 (i.e., 23,897 - 100)
📖 Understanding The Gap Down Setup:
A Gap Down of 100+ points after yesterday's already massive crash would be an extreme bearish signal. This would open the market directly inside or below the orange pivot zone of 23,801–23,836 — and potentially threaten the 23,655–23,723 Last Intraday Support Zone immediately.
This scenario would mean:
🔸 Two consecutive heavy bearish sessions — rare but powerful signal
🔸 Likely driven by extremely negative global overnight cues
🔸 Possible circuit breaker territory if selling is extreme
🔸 Panic selling will be maximum — emotional decisions will destroy accounts
Two key questions in this scenario:
1️⃣ Does the market find support at 23,655–23,723? (Green zone — Last Intraday Support)
2️⃣ Or does it collapse all the way to 23,381? (Major Green Support — Extended Target)
Rule #1 in gap down after crash = DO NOT PANIC SELL THE LOWS 🚫
📋 TRADE PLAN — GAP DOWN OPENING:
⏳ Maximum Patience Required:
After gap down following a crash day — wait for minimum 15-20 minutes. Let the opening panic exhaust itself. Look for:
✅ Selling climax (massive red candle followed by sharp recovery) = Bounce signal
✅ Sustained lower highs on recovery attempts = Continuation signal
🟢 BULLISH PLAN — Bounce/Long Setup (Gap Down Support Hold):
🔵 Setup: Market gaps down but finds strong support at 23,655–23,723 (Last Intraday Support — green zone on chart). Bullish reversal candle forms — hammer, doji, or engulfing. Institutional buying visible.
🔵 Entry Trigger: Buy above 23,730 (confirmed bounce above support zone)
🔵 Target 1: 23,836 (upper boundary of orange pivot zone)
🔵 Target 2: 23,897 (previous close — full gap fill)
🔵 Target 3: 23,992 🎯 (Opening resistance — strong recovery target)
🔵 Stop Loss: Below 23,640 (below Last Intraday Support zone = no bounce)
📌 Options Strategy (Educational):
Buy 23,750 CE or 23,800 CE on confirmed bounce above 23,730
⚡ Bounce trades from major support zones = High reward potential
⚡ But in two consecutive crash scenarios — keep lot size at minimum (1 lot only)
⚡ Book 50% profit at T1 without fail — don't let a winning bounce trade turn into a loser
🔴 BEARISH PLAN — Short Setup / Continuation (Gap Down, Support Breaks):
🔵 Setup: Market gaps down and breaks below 23,655 (lower boundary of Last Intraday Support zone). No meaningful bounce. Panic selling continues. This is the most extreme bearish scenario.
🔵 Entry Trigger: Short below 23,640 (confirmed breakdown of all support)
🔵 Target 1: 23,500
🔵 Target 2: 23,381 🎯 (Extended Bear Target — Major Green Support Line on Chart)
🔵 Target 3: 23,250 (if 23,381 also breaks — extreme panic scenario)
🔵 Stop Loss: Above 23,730 (back inside support zone = short plan invalid)
📌 Options Strategy (Educational):
Buy 23,600 PE or 23,400 PE on confirmed breakdown below 23,640
⚡ In extreme breakdown scenarios — DO NOT buy deep OTM puts in panic
⚡ Near-the-money strikes only — better delta and response
⚡ Keep position size very small — volatility can reverse sharply at any point
🟠 NO TRADE ZONE (Gap Down Scenario):
Market gaps down and oscillates between 23,640 – 23,730 = Confusion zone ⛔
🔵 Support is being tested but not yet broken
🔵 Both bounce and breakdown are possible
🔵 This is the most dangerous zone to be in — maximum whipsaw risk
🔵 Best action = Do absolutely nothing. Watch only.
"Two consecutive crash days demand maximum respect and minimum action. The market is volatile, emotional and unpredictable. Your discipline in NOT trading is your biggest edge here." 💪
💡 Gap Down Emergency Tip for 09-Jul:
If market gaps down heavily and 23,381 is approached directly — this is a MAJOR long-term support on higher timeframes. Extreme panic selling into this zone historically provides excellent bounce opportunities — but only for experienced traders with defined risk. Beginners should simply watch and learn. 📚
🛡️ RISK MANAGEMENT TIPS FOR OPTIONS TRADING
(After a 450-Point Crash Day — These Tips Are More Important Than Ever)
📌 Tip 1 — Reduce Position Size After Volatile Days:
🔵 Yesterday's 450-point crash means IV (Implied Volatility) is elevated today
🔵 High IV = Expensive option premiums = Higher risk for buyers
🔵 Solution: Trade half your normal lot size until market stabilizes
🔵 This protects your capital while still allowing participation
📌 Tip 2 — The Bounce Trade Golden Rule:
🔵 After a massive crash, bounces look tempting
🔵 But "dead cat bounces" are common — they go up briefly then crash again
🔵 Rule: Take only 50% of your normal profit target on bounce trades after crash days
🔵 Don't expect a V-shape recovery immediately — it rarely happens
📌 Tip 3 — Never Average Down on Options:
🔵 If your CE is losing after a crash — DO NOT BUY MORE
🔵 Options lose value exponentially as they go OTM
🔵 Averaging options = Multiplying your losses, not reducing them
🔵 Cut, reassess, re-enter fresh if setup confirms
📌 Tip 4 — The 30-40% Premium Stop Loss Rule:
🔵 Entry CE at ₹100 → Exit compulsorily at ₹65 (35% SL)
🔵 Entry PE at ₹80 → Exit compulsorily at ₹52 (35% SL)
🔵 Set this as a mental rule before every entry — not after loss starts
🔵 This single rule saves most retail traders from account blow-ups ✅
📌 Tip 5 — High Volatility = Wider Stops, Smaller Size:
🔵 After a crash, market swings are wider than normal
🔵 Normal 20-point SL may not work — market can swing 50-80 points easily
🔵 Solution: Wider SL + Proportionally smaller position size = Same risk
🔵 Example: Normal trade = 2 lots, 25-pt SL → Post-crash = 1 lot, 50-pt SL
📌 Tip 6 — Avoid Overtrading on High Volatility Days:
🔵 High volatility = More signals = More temptation to trade
🔵 But more trades ≠ More profits
🔵 After a crash day — limit yourself to maximum 2 trades for the entire day
🔵 Quality over quantity. Always. 🎯
📌 Tip 7 — Pre-Market Checklist for 09-Jul:
🔵 Check Gift Nifty / SGX Nifty at 8:00 AM — gap indicator
🔵 Check US Markets (Dow, S&P, Nasdaq) — did they recover or fall further?
🔵 Check Asia Markets at 9:00 AM (Nikkei, Hang Seng, Kospi)
🔵 Check FII/DII data from 08-Jul (available on NSE website)
🔵 Check any major news/events — budget, RBI, global macro
🔵 This 15-minute homework = Your market bias compass 🧭
📝 SUMMARY & CONCLUSION
📊 08-Jul Recap in Brief:
🔴 Massive 450+ point single session crash
🔴 All planned support levels broken
🔴 Bearish dashed path played out completely
🔴 Closed at 23,897 — setting up a fresh battle zone
💡 Key learning: When trend is strong, don't fight it — ride it with SL ✅
📊 09-Jul Complete Level Reference Table:
Zone Level Type Action
🔴 Last Intraday Resistance 24,111 Red Line Strong Sell/Short Zone
🔴 Opening Resistance 23,992 Red Line Sell/Resistance Zone
🟠 CMP Reference 23,897 Blue Current Price
🟠 Main Pivot Zone 23,801 – 23,836 Orange Decision Zone — No Trade
🟢 Last Intraday Support 23,655 – 23,723 Green Zone Buy/Long Zone
🟢 Extended Bear Target 23,381 Green Line Major Support / Bear Target
🎯 Overall Bias for 09-Jul-2026:
📌 Short-term bias: STRONGLY BEARISH (after 450-pt crash close)
📌 Recovery possible ONLY IF market reclaims 23,992+ convincingly
📌 Bears firmly in control below 23,836
📌 Dashed lines on chart show two probable paths:
→ 🟢 Recovery dashed path: Bounce → 23,992 → 24,111
→ 🔴 Continuation dashed path: Break → 23,723 → 23,655 → 23,381
Key message: Respect the levels. Respect the trend. Don't be a hero. 🎯
🌟 Final Takeaways:
🔵 Orange zone 23,801–23,836 = Most critical zone tomorrow
🔵 Above orange zone + sustain = Recovery trade toward 23,992–24,111
🔵 Below orange zone + sustain = Short trade toward 23,655–23,381
🔵 Dashed lines = Probable paths only — never trade without confirmation
🔵 Green lines = Support zones — look for bounce confirmation here
🔵 Red lines = Resistance zones — look for rejection confirmation here
🔵 After a crash day — smaller size, wider stops, fewer trades 🛡️
🔵 Capital preservation is the #1 priority after a volatile session
"The market humbles the overconfident and rewards the disciplined. After a storm, the best traders don't rush back in — they wait for the dust to settle, identify the new levels, and then act with precision." 💚
"Yesterday's crash is today's lesson. Today's plan is tomorrow's edge." 🔄
⚠️ DISCLAIMER
📢 I am NOT a SEBI Registered Research Analyst or Investment Advisor.
🔴 This post is purely for educational and informational purposes only.
🔴 All levels, scenarios, trade setups and analysis shared here are based on personal technical chart reading and represent NO buy/sell recommendations of any kind.
🔴 Options and futures trading involves substantial financial risk. You can lose your entire invested capital — especially in high volatility environments like post-crash sessions.
🔴 Past accuracy of levels and plans does NOT guarantee future performance.
🔴 The market conditions described are based on chart reading only — fundamental, macroeconomic and global factors may alter price behaviour significantly.
🔴 Always consult a SEBI Registered Financial Advisor before making any investment or trading decisions.
🔴 The author holds absolutely no responsibility for any financial gains or losses arising directly or indirectly from the use of this information.
Trade Safe. Trade Smart. Protect Your Capital First. Always. 🙏
📊 Chart: Nifty 50 Index | Timeframe: 15-Min | Exchange: NSE | Source: TradingView
📅 Plan Date: 09-July-2026 | Regular Trading Session
🕗 Plan Published: Post Market Close 08-Jul-2026 | 22:32 IST
👍 If this analysis added value — Like & Follow for daily plans!
🔖 Save this post for reference during tomorrow's market hours!
💬 Drop your view below — Bullish bounce or Bearish continuation for 09-Jul?
#Nifty #Nifty50 #NiftyAnalysis #TradingPlan #StockMarketIndia #NSE #TechnicalAnalysis #OptionsTrading #NiftyOptions #DayTrading #PriceAction #ChartAnalysis #LearnTrading #TradingEducation #RiskManagement #IndianStockMarket #MarketAnalysis #TradeSetup #TradeSmart #NiftyLevels #PostCrash #MarketCrash #IndexTrading #TradingCommunity #FinanceIndia #StockMarket #TradingLife #MarketOutlook #NiftyPrediction #BearMarket

Related publications
Disclaimer
The information and publications are not meant to be, and do not constitute, financial, investment, trading, or other types of advice or recommendations supplied or endorsed by TradingView. Read more in the Terms of Use.
Related publications
Disclaimer
The information and publications are not meant to be, and do not constitute, financial, investment, trading, or other types of advice or recommendations supplied or endorsed by TradingView. Read more in the Terms of Use.