
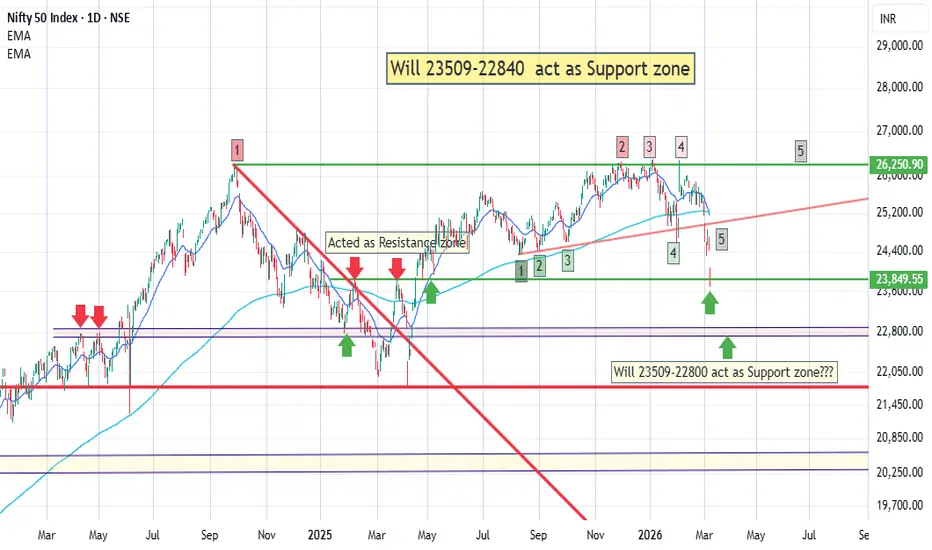
- Nifty is trading below 21 day EMA which is below 63 day EMA and has also broken below 200 day EMA
- Nifty has followed the 2-3-5 rule where it take 2 points to create a trend line... 3 to confirm and take the trade and on the 5th attempt it weakens and breaks the trend. The strength of the Support is reflected with fading green color.
- At current levels Nifty is is looking weak
- Markets are oversold (and can remain oversold and fall even further)
- however it is important to note, at current levels Nifty is also near levels which has played crucial role as resistance and support in past.
- 23509 and 22840 levels are crucial Fibo levels to watch out for
- from a 5 year horizon, Risk::Reward ratio looks reasonably favorable from Long term perspective especially on any dips, where the down side risk may be 5-7% and on the upside, it has the potential to give 12-13% CAGR over a 5 year period
Fundamentally speaking Nifty
- Price to Earning ratio is 21.02 (Above 24 is considered expensive and below 19 is considered value zone so at 21 can be considered Fairly valued)
- Dividend yield is 1.3 ( 0.8 is considered expensive and above 1.8 is considered extreme value)
- There is lot of News and Noise going around the world. Just sharing some insights and the way I am looking at market.
- Also on longer term time frame the 2-3-5 marked in weakening red colour suggests the next time we see Nifty around 26300 there is a higher probability of that resistance been broken.
Disclaimer:
- These are not buy or sell recommendations.
- I have been wrong in the past and it is very much possible that I can go wrong again in the future
- It is your hard earned money... treat it wisely
- Nifty has followed the 2-3-5 rule where it take 2 points to create a trend line... 3 to confirm and take the trade and on the 5th attempt it weakens and breaks the trend. The strength of the Support is reflected with fading green color.
- At current levels Nifty is is looking weak
- Markets are oversold (and can remain oversold and fall even further)
- however it is important to note, at current levels Nifty is also near levels which has played crucial role as resistance and support in past.
- 23509 and 22840 levels are crucial Fibo levels to watch out for
- from a 5 year horizon, Risk::Reward ratio looks reasonably favorable from Long term perspective especially on any dips, where the down side risk may be 5-7% and on the upside, it has the potential to give 12-13% CAGR over a 5 year period
Fundamentally speaking Nifty
- Price to Earning ratio is 21.02 (Above 24 is considered expensive and below 19 is considered value zone so at 21 can be considered Fairly valued)
- Dividend yield is 1.3 ( 0.8 is considered expensive and above 1.8 is considered extreme value)
- There is lot of News and Noise going around the world. Just sharing some insights and the way I am looking at market.
- Also on longer term time frame the 2-3-5 marked in weakening red colour suggests the next time we see Nifty around 26300 there is a higher probability of that resistance been broken.
Disclaimer:
- These are not buy or sell recommendations.
- I have been wrong in the past and it is very much possible that I can go wrong again in the future
- It is your hard earned money... treat it wisely

Disclaimer
The information and publications are not meant to be, and do not constitute, financial, investment, trading, or other types of advice or recommendations supplied or endorsed by TradingView. Read more in the Terms of Use.
Disclaimer
The information and publications are not meant to be, and do not constitute, financial, investment, trading, or other types of advice or recommendations supplied or endorsed by TradingView. Read more in the Terms of Use.