
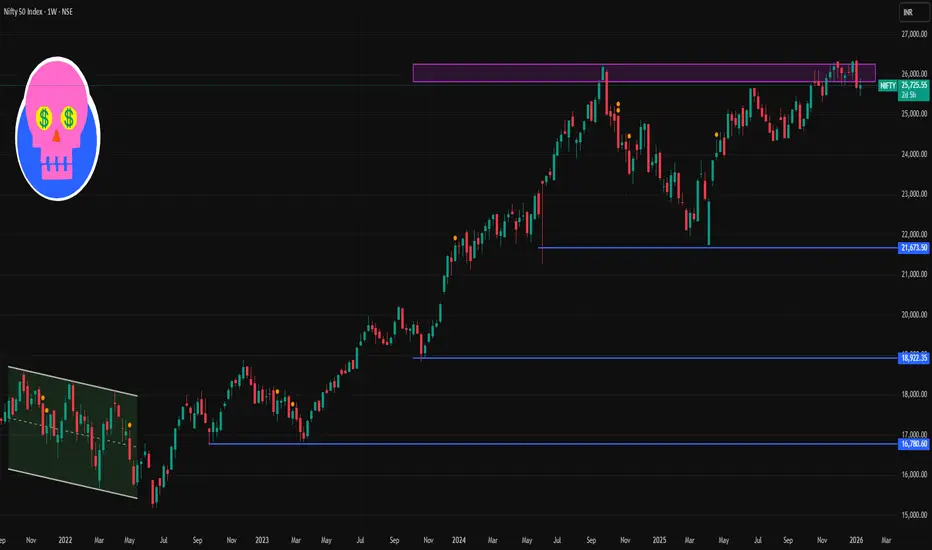
📌 Current Weekly Price (Live)
Nifty 50 approx ~25,730–25,740 (latest live level) — slight downside bias today.
📈 Weekly Resistance Levels (Upside)
1. 25,900 – 26,000 zone
• Immediate resistance above current price — key psychological barrier.
2. 26,100 – 26,200 zone
• Strong technical resistance (previous weekly highs & upper band).
3. 26,300+
• If breakout above 26,200 sustains, next upper resistance.
📉 Weekly Support Levels (Downside)
1. 25,600–25,650
• Near-term support from recent weekly structure.
2. 25,300–25,350
• Secondary support; zone where price has bounced previously on weekly charts.
3. 24,800–24,700
• Major structural support — breach here opens deeper correction risk.
📊 Weekly Technical Range to Watch
Neutral/Range-Bound View (Weekly):
⬆️ Bullish: Break & weekly close above 26,000–26,200
⬇️ Bearish: Break & close below 25,300–25,350
Between these levels, the index may consolidate before a clear directional move.
📌 Summary Weekly Levels (2026)
Resistance Zones
• 26,000 (key psychological)
• 26,100–26,200 (secondary)
• 26,300+ (extended)
Support Zones
• 25,600–25,650 (immediate)
• 25,300–25,350 (secondary)
• 24,800–24,700 (major)

Contact Knowledgehub for a detailed consultation: Dm on WhatsApp: [wa.link/a2o0kz]-
Phone No: [+91 93102 26243]-
Email: [tradingviewknowledgehub@gmail.com]---
-- Let’s achieve success together!
Phone No: [+91 93102 26243]-
Email: [tradingviewknowledgehub@gmail.com]---
-- Let’s achieve success together!
Related publications
Disclaimer
The information and publications are not meant to be, and do not constitute, financial, investment, trading, or other types of advice or recommendations supplied or endorsed by TradingView. Read more in the Terms of Use.