
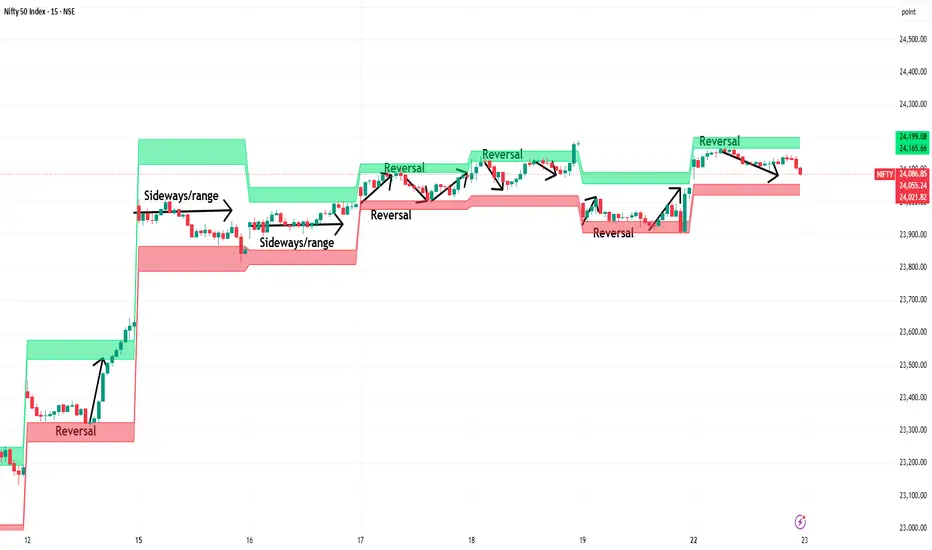
This tutorial explains a practical approach to identifying three key market conditions — reversals, breakouts, and sideways/range-bound markets — using auto-generated support/resistance levels. Based on a real Nifty 15-minute chart.
Markets: Nifty 50
Timeframe: 15-minute intraday
Part 1: Current Market Setup
From the chart:
Resistance Zone: ~24,200 (marked as "Reversal" on chart)
Middle/Range Zone: 24,000-24,100 (marked as "Sideways/Range" on chart)
Support Zone: ~23,800 (marked as "Reversal" on chart)
Current Market Condition: Sideways/Range between 23,800 and 24,200
Key Insight: When price is between support and resistance with no clear direction, it's a sideways/range-bound market. The best action is to wait for breakout or breakdown.
Part 2: Identifying Sideways Market
Sideways defined: Price is trading between a defined Support level (~23,800) and Resistance level (~24,200), with no clear direction.
How to Identify:
Price repeatedly bounces between same support and resistance levels
Price oscillates around VWAP
EMAs are flat, not sloping
Volume is average or declining
Best Action: No trade. Wait for breakout or breakdown.
Active Strategy (For Experienced Traders):
Buy near support with bullish candle confirmation
Sell near resistance with bearish candle confirmation
Stop-loss just beyond the level
Part 3: Identifying Reversal
Reversal defined: Price reaches a support/resistance extreme and changes direction.
From the chart:
At ~24,200 (Resistance) → Bearish Reversal → Price rejected from resistance
At ~23,800 (Support) → Bullish Reversal → Price bounced from support
Reversal Confirmation Checklist:
Price touches support or resistance
Rejection candle confirms (pin bar, engulfing, hammer/shooting star)
Volume spike on reversal candle
Decision Rules:
If price rejects resistance with bearish candle → Consider SELL
If price rejects support with bullish candle → Consider BUY
If price breaks level without resistance → Fakeout/Sweep
Part 4: Identifying Breakout
Breakout defined: Price closes beyond a key support or resistance level with momentum confirmation.
From the chart:
Bullish Breakout: Above 24,200 (Resistance) → Close above + volume confirmation
Bearish Breakdown: Below 23,800 (Support) → Close below + volume confirmation
Breakout Confirmation Checklist:
Price closes above resistance (bullish) or below support (bearish)
Volume above 2x average
Momentum confirmed (MACD/RSI alignment)
Decision Rules:
If price breaks level with volume and momentum → Trade the breakout
If price breaks level without volume → Wait for retest
If price breaks and immediately reverses → Fakeout
Part 5: Complete Decision Rules
Price between 23,800-24,200 → Sideways/Range → Wait or range trade
Price closes above 24,200 → Resistance Breakout → BUY with volume confirmation
Price closes below 23,800 → Support Breakdown → SELL with volume confirmation
Price rejects 24,200 with bearish candle → Resistance Rejection → SELL
Price rejects 23,800 with bullish candle → Support Rejection → BUY
Price breaks 24,200, quickly reverses → Fakeout → Wait for retest
Price breaks 23,800, quickly reverses → Fakeout → Wait for retest
Part 6: Why This Works
Levels define boundaries → Support/resistance give you clear zones
Volume confirms → Differentiates genuine breakouts from fakeouts
Rejection confirms → Shows institutional activity at extremes
Sideways defined → Avoids overtrading in chop
For Automation
These reversal/breakout conditions can be set as TradingView alerts with webhook configuration.
Alert Conditions:
Price closes above 24,200 → Breakout alert
Price closes below 23,800 → Breakdown alert
Price rejects 24,200 with bearish candle → Reversal alert
Price rejects 23,800 with bullish candle → Reversal alert
Disclaimer
This is for educational purposes only. Trading involves risk. Past performance does not guarantee future results.
Markets: Nifty 50
Timeframe: 15-minute intraday
Part 1: Current Market Setup
From the chart:
Resistance Zone: ~24,200 (marked as "Reversal" on chart)
Middle/Range Zone: 24,000-24,100 (marked as "Sideways/Range" on chart)
Support Zone: ~23,800 (marked as "Reversal" on chart)
Current Market Condition: Sideways/Range between 23,800 and 24,200
Key Insight: When price is between support and resistance with no clear direction, it's a sideways/range-bound market. The best action is to wait for breakout or breakdown.
Part 2: Identifying Sideways Market
Sideways defined: Price is trading between a defined Support level (~23,800) and Resistance level (~24,200), with no clear direction.
How to Identify:
Price repeatedly bounces between same support and resistance levels
Price oscillates around VWAP
EMAs are flat, not sloping
Volume is average or declining
Best Action: No trade. Wait for breakout or breakdown.
Active Strategy (For Experienced Traders):
Buy near support with bullish candle confirmation
Sell near resistance with bearish candle confirmation
Stop-loss just beyond the level
Part 3: Identifying Reversal
Reversal defined: Price reaches a support/resistance extreme and changes direction.
From the chart:
At ~24,200 (Resistance) → Bearish Reversal → Price rejected from resistance
At ~23,800 (Support) → Bullish Reversal → Price bounced from support
Reversal Confirmation Checklist:
Price touches support or resistance
Rejection candle confirms (pin bar, engulfing, hammer/shooting star)
Volume spike on reversal candle
Decision Rules:
If price rejects resistance with bearish candle → Consider SELL
If price rejects support with bullish candle → Consider BUY
If price breaks level without resistance → Fakeout/Sweep
Part 4: Identifying Breakout
Breakout defined: Price closes beyond a key support or resistance level with momentum confirmation.
From the chart:
Bullish Breakout: Above 24,200 (Resistance) → Close above + volume confirmation
Bearish Breakdown: Below 23,800 (Support) → Close below + volume confirmation
Breakout Confirmation Checklist:
Price closes above resistance (bullish) or below support (bearish)
Volume above 2x average
Momentum confirmed (MACD/RSI alignment)
Decision Rules:
If price breaks level with volume and momentum → Trade the breakout
If price breaks level without volume → Wait for retest
If price breaks and immediately reverses → Fakeout
Part 5: Complete Decision Rules
Price between 23,800-24,200 → Sideways/Range → Wait or range trade
Price closes above 24,200 → Resistance Breakout → BUY with volume confirmation
Price closes below 23,800 → Support Breakdown → SELL with volume confirmation
Price rejects 24,200 with bearish candle → Resistance Rejection → SELL
Price rejects 23,800 with bullish candle → Support Rejection → BUY
Price breaks 24,200, quickly reverses → Fakeout → Wait for retest
Price breaks 23,800, quickly reverses → Fakeout → Wait for retest
Part 6: Why This Works
Levels define boundaries → Support/resistance give you clear zones
Volume confirms → Differentiates genuine breakouts from fakeouts
Rejection confirms → Shows institutional activity at extremes
Sideways defined → Avoids overtrading in chop
For Automation
These reversal/breakout conditions can be set as TradingView alerts with webhook configuration.
Alert Conditions:
Price closes above 24,200 → Breakout alert
Price closes below 23,800 → Breakdown alert
Price rejects 24,200 with bearish candle → Reversal alert
Price rejects 23,800 with bullish candle → Reversal alert
Disclaimer
This is for educational purposes only. Trading involves risk. Past performance does not guarantee future results.

FinvestAlgo | Multi-broker automation bridge | TV indicators/strategies/screeners + Chartink scanners |Python+Amibroker+MT5 Automations & Developments |Supported 28+ Brokers
DM for access
DM for access
Disclaimer
The information and publications are not meant to be, and do not constitute, financial, investment, trading, or other types of advice or recommendations supplied or endorsed by TradingView. Read more in the Terms of Use.
FinvestAlgo | Multi-broker automation bridge | TV indicators/strategies/screeners + Chartink scanners |Python+Amibroker+MT5 Automations & Developments |Supported 28+ Brokers
DM for access
DM for access
Disclaimer
The information and publications are not meant to be, and do not constitute, financial, investment, trading, or other types of advice or recommendations supplied or endorsed by TradingView. Read more in the Terms of Use.