
🟢 Nifty Analysis EOD – April 30, 2026 – Thursday 🔴
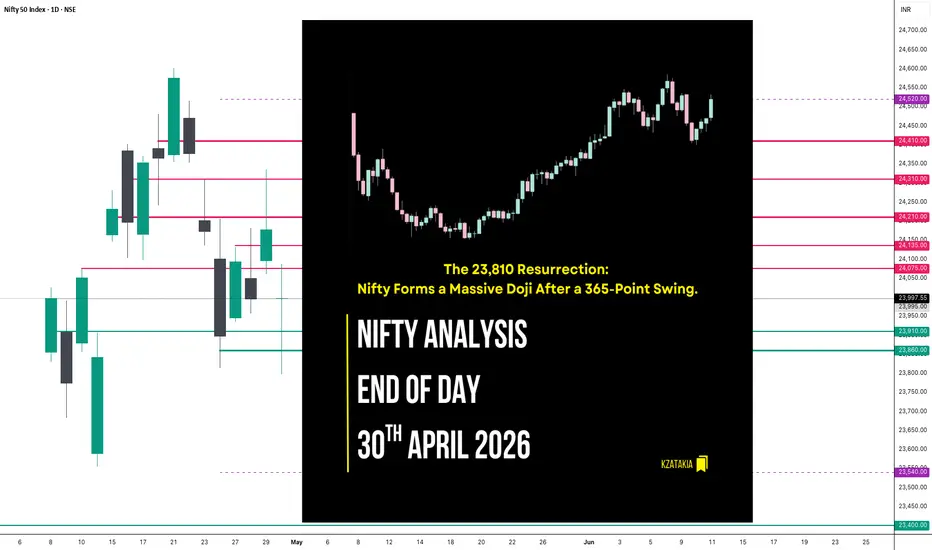
The 23,810 Resurrection: Nifty Forms a Massive Doji After a 365-Point Swing.
🗞 Nifty Summary
Nifty concluded the month with a session of extreme theater and technical recovery.
The day began with a painful 145-point Gap Down, starting well below the Previous Day Low (PDL). The selling pressure intensified during the first hour, as the index bled another 220 points to test the crucial support level at 23,810. At this base, the bears finally met their match; Nifty entered a “silent” phase, building a floor for nearly two hours within a narrow 40–50 point range.
Around 12:05 PM, the index gave a decisive breakout from this accumulation zone, initiating a slow but relentless 265-point recovery from the lows. During this ascent, Nifty breached its earlier intraday high and attempted to reclaim the PDL. However, the 24,075 zone—which had acted as a rock-solid support in previous sessions—saw a polarity change, acting as a stiff resistance ceiling.
Nifty marked a day high of 24,087.45 and eventually settled at 24,043.70 (Adjusted Close: 23,997.55). Although the net change remains negative at -180.10 points (-0.74%), the intraday price action reflects a total rejection of the morning’s panic.
The day was exceptionally tricky for intraday participants. Starting below the PDL and witnessing a further 220-point drop created a high-conviction bearish bias that made the mid-session recovery difficult to anticipate. Capturing the turnaround without a clear news catalyst was a challenge, as the directional shift required a complete mental reset from the morning’s “blood on the streets” environment. The resulting Daily Candle is a Positive Doji, suggesting that while the day belongs to the bears on a net-change basis, the bulls have successfully defended the 23,800 territory.
🛡 5 Min Intraday Chart with Levels

📉 Daily Time Frame Chart with Intraday Levels

🕯 Daily Candle Breakdown
Open: 23,996.95
High: 24,087.45
Low: 23,796.85
Close: 23,997.55
Change: -180.10 (-0.74%)
🏗️ Structure Breakdown
Type: Indecision candle (Doji).
Range: ≈ 291 points — high intraday volatility.
Body: ≈ 1 point — negligible real body, signaling a total standoff between open and close.
Upper Wick: ≈ 90 points — rejection encountered at the 24,075 polarity flip zone.
Lower Wick: ≈ 200 points — powerful rejection of lower prices at the 23,810 base.
🛡 5 Min Intraday Chart

⚔️ Gladiator Strategy Update
ATR: 350.72
IB Range: 171.55 → Medium
Market Structure: ImBalanced
Trade Highlights:
No Trade
Trade Note: Today was a day for discipline rather than action. The 145-point gap down combined with a 160-point Initial Balance (IB) meant that over 300 points of range were consumed within the first hour.
Because the market opened below the PDL, the system maintained a strong bearish bias, which negated any long signals during the recovery.
Conversely, because the index had already hit the major 23,810 support zone and covered its expected daily move so quickly, the system correctly avoided the IBL breakout short. Sitting on hands was a great decision today.
🧱 Support & Resistance Levels
Resistance Zones: 24,075 | 24,135 | 24,210
Support Zones: 23,910 | 23,860 | 23,810
🧠 Final Thoughts
“The market often speaks most clearly when we are too confused to listen.”
Tomorrow is a holiday, providing a much-needed break after this volatile week.
When we return on Monday, today’s high (24,087) and low (23,796) will serve as our primary guiding zones. There are many macro events scheduled over the weekend that could shift the landscape, so we will wait for the Monday opening tick before forming a fresh bias.
For now, I am closing the terminal to chill and enjoy the long weekend with friends and family. I hope you do the same!
✏️ Disclaimer
This is my personal digital diary and represents my own analysis and point of view. It is not financial advice; please consult a professional advisor before making any trading decisions.
The 23,810 Resurrection: Nifty Forms a Massive Doji After a 365-Point Swing.
🗞 Nifty Summary
Nifty concluded the month with a session of extreme theater and technical recovery.
The day began with a painful 145-point Gap Down, starting well below the Previous Day Low (PDL). The selling pressure intensified during the first hour, as the index bled another 220 points to test the crucial support level at 23,810. At this base, the bears finally met their match; Nifty entered a “silent” phase, building a floor for nearly two hours within a narrow 40–50 point range.
Around 12:05 PM, the index gave a decisive breakout from this accumulation zone, initiating a slow but relentless 265-point recovery from the lows. During this ascent, Nifty breached its earlier intraday high and attempted to reclaim the PDL. However, the 24,075 zone—which had acted as a rock-solid support in previous sessions—saw a polarity change, acting as a stiff resistance ceiling.
Nifty marked a day high of 24,087.45 and eventually settled at 24,043.70 (Adjusted Close: 23,997.55). Although the net change remains negative at -180.10 points (-0.74%), the intraday price action reflects a total rejection of the morning’s panic.
The day was exceptionally tricky for intraday participants. Starting below the PDL and witnessing a further 220-point drop created a high-conviction bearish bias that made the mid-session recovery difficult to anticipate. Capturing the turnaround without a clear news catalyst was a challenge, as the directional shift required a complete mental reset from the morning’s “blood on the streets” environment. The resulting Daily Candle is a Positive Doji, suggesting that while the day belongs to the bears on a net-change basis, the bulls have successfully defended the 23,800 territory.
🛡 5 Min Intraday Chart with Levels
📉 Daily Time Frame Chart with Intraday Levels
🕯 Daily Candle Breakdown
Open: 23,996.95
High: 24,087.45
Low: 23,796.85
Close: 23,997.55
Change: -180.10 (-0.74%)
🏗️ Structure Breakdown
Type: Indecision candle (Doji).
Range: ≈ 291 points — high intraday volatility.
Body: ≈ 1 point — negligible real body, signaling a total standoff between open and close.
Upper Wick: ≈ 90 points — rejection encountered at the 24,075 polarity flip zone.
Lower Wick: ≈ 200 points — powerful rejection of lower prices at the 23,810 base.
🛡 5 Min Intraday Chart
⚔️ Gladiator Strategy Update
ATR: 350.72
IB Range: 171.55 → Medium
Market Structure: ImBalanced
Trade Highlights:
No Trade
Trade Note: Today was a day for discipline rather than action. The 145-point gap down combined with a 160-point Initial Balance (IB) meant that over 300 points of range were consumed within the first hour.
Because the market opened below the PDL, the system maintained a strong bearish bias, which negated any long signals during the recovery.
Conversely, because the index had already hit the major 23,810 support zone and covered its expected daily move so quickly, the system correctly avoided the IBL breakout short. Sitting on hands was a great decision today.
🧱 Support & Resistance Levels
Resistance Zones: 24,075 | 24,135 | 24,210
Support Zones: 23,910 | 23,860 | 23,810
🧠 Final Thoughts
“The market often speaks most clearly when we are too confused to listen.”
Tomorrow is a holiday, providing a much-needed break after this volatile week.
When we return on Monday, today’s high (24,087) and low (23,796) will serve as our primary guiding zones. There are many macro events scheduled over the weekend that could shift the landscape, so we will wait for the Monday opening tick before forming a fresh bias.
For now, I am closing the terminal to chill and enjoy the long weekend with friends and family. I hope you do the same!
✏️ Disclaimer
This is my personal digital diary and represents my own analysis and point of view. It is not financial advice; please consult a professional advisor before making any trading decisions.

Read my blogs here:
substack.com/@kzatakia
Follow me on Telegram:
t.me/swingtraderhub
Follow me on X:
x.com/kzatakia
substack.com/@kzatakia
Follow me on Telegram:
t.me/swingtraderhub
Follow me on X:
x.com/kzatakia
Related publications
Disclaimer
The information and publications are not meant to be, and do not constitute, financial, investment, trading, or other types of advice or recommendations supplied or endorsed by TradingView. Read more in the Terms of Use.
Read my blogs here:
substack.com/@kzatakia
Follow me on Telegram:
t.me/swingtraderhub
Follow me on X:
x.com/kzatakia
substack.com/@kzatakia
Follow me on Telegram:
t.me/swingtraderhub
Follow me on X:
x.com/kzatakia
Related publications
Disclaimer
The information and publications are not meant to be, and do not constitute, financial, investment, trading, or other types of advice or recommendations supplied or endorsed by TradingView. Read more in the Terms of Use.