
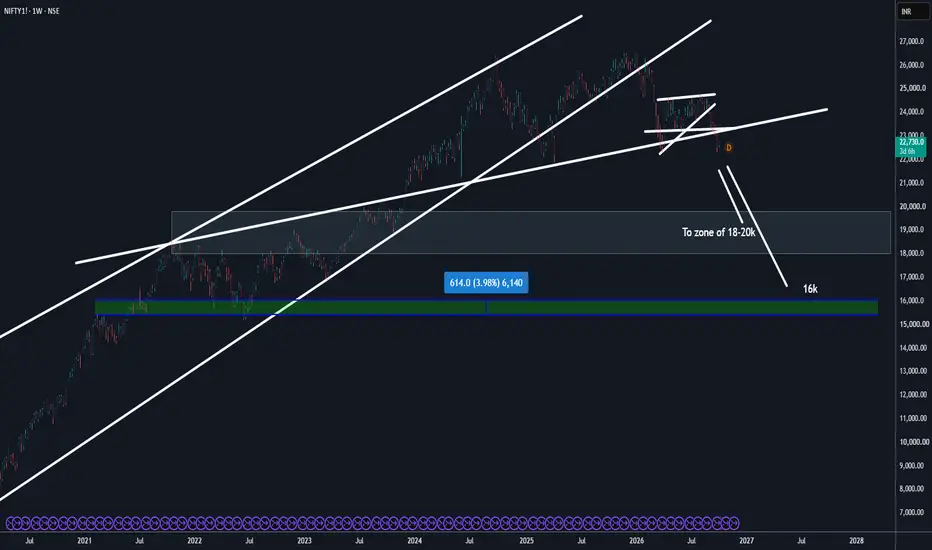
📈 Chart Overview & Instrument DetailsInstrument: NIFTY (Nifty 50 Index)Exchange: NSE (National Stock Exchange of India)Timeframe: 1W (Weekly Chart)Current Price (CMP): ~22,744.0
📊 Technical Analysis1. Macro Trend Structure & Channel Dynamics: On the weekly timeframe, Nifty 50 is testing a critical structural junction. After a powerful multi-year impulsive expansion characterized by higher highs and higher lows, price action has entered a corrective phase, forming a descending medium-term channel or consolidation pattern beneath major macro trendline resistances.
The Upper Boundary: The primary ascending trendline extending from prior swing bases continues to cap upside momentum, forcing multiple rejections whenever price attempts a structural recovery.
The Lower Boundary: Price is compressing toward a heavy confluence region near the macro support floor. A failure to defend this multi-touch zone opens structural room toward deeper historical liquidity pools (annotated near the 18,000–20,000 zone on the lower structural range).
Momentum & Oscillator Confluence: RSI & Moving Average Ribbons: The intermediate momentum indicators are sloping downward, reflecting a transition from impulsive bullish expansion to a corrective distribution structure. The moving average overlays show a narrowing spread, signaling fading trend momentum on higher timeframes. Volume Profile & Histogram: The lower oscillator sub-pane points to declining net buying volume during recent recovery bounces, contrasting with heavier volume footprints on prior impulsive green phases. This divergence underlines seller control during corrective upswings.
🎯 Scenario Planning & Key Levels
🟢 Bullish Scenario (Reversal / Range Defense)If buyers step in to defend the current macro support floor and print a successful weekly higher-low confirmation: Immediate Resistance / Pivot: 22,750 – 23,100
Target 1: 24,000 psychological barrier.
Target 2: Upper channel trendline retest near 25,000+.
Invalidation / Confirmation: A high-volume weekly close breaking cleanly back above the descending trendline resistance.
🔴 Bearish Scenario (Macro Breakdown / Correction Extension)If sustained selling pressure breaks the immediate multi-week consolidation floor: Immediate Support: 22,000 – 22,200 zone.
Target 1: 21,600 structural swing support.
Target 2 (Macro Target): Deep correction liquidity band into the 18,000 – 20,000 zone (as outlined on the chart structure).
Invalidation / Confirmation: A confirmed weekly candle close below the primary lower channel support with expanding volume.
This analysis is strictly educational and intended for structural chart evaluation purposes. Monitor price action closely at key horizontal pivots and manage risk according to your individual trading plan.
📊 Technical Analysis1. Macro Trend Structure & Channel Dynamics: On the weekly timeframe, Nifty 50 is testing a critical structural junction. After a powerful multi-year impulsive expansion characterized by higher highs and higher lows, price action has entered a corrective phase, forming a descending medium-term channel or consolidation pattern beneath major macro trendline resistances.
The Upper Boundary: The primary ascending trendline extending from prior swing bases continues to cap upside momentum, forcing multiple rejections whenever price attempts a structural recovery.
The Lower Boundary: Price is compressing toward a heavy confluence region near the macro support floor. A failure to defend this multi-touch zone opens structural room toward deeper historical liquidity pools (annotated near the 18,000–20,000 zone on the lower structural range).
Momentum & Oscillator Confluence: RSI & Moving Average Ribbons: The intermediate momentum indicators are sloping downward, reflecting a transition from impulsive bullish expansion to a corrective distribution structure. The moving average overlays show a narrowing spread, signaling fading trend momentum on higher timeframes. Volume Profile & Histogram: The lower oscillator sub-pane points to declining net buying volume during recent recovery bounces, contrasting with heavier volume footprints on prior impulsive green phases. This divergence underlines seller control during corrective upswings.
🎯 Scenario Planning & Key Levels
🟢 Bullish Scenario (Reversal / Range Defense)If buyers step in to defend the current macro support floor and print a successful weekly higher-low confirmation: Immediate Resistance / Pivot: 22,750 – 23,100
Target 1: 24,000 psychological barrier.
Target 2: Upper channel trendline retest near 25,000+.
Invalidation / Confirmation: A high-volume weekly close breaking cleanly back above the descending trendline resistance.
🔴 Bearish Scenario (Macro Breakdown / Correction Extension)If sustained selling pressure breaks the immediate multi-week consolidation floor: Immediate Support: 22,000 – 22,200 zone.
Target 1: 21,600 structural swing support.
Target 2 (Macro Target): Deep correction liquidity band into the 18,000 – 20,000 zone (as outlined on the chart structure).
Invalidation / Confirmation: A confirmed weekly candle close below the primary lower channel support with expanding volume.
This analysis is strictly educational and intended for structural chart evaluation purposes. Monitor price action closely at key horizontal pivots and manage risk according to your individual trading plan.

Disclaimer
The information and publications are not meant to be, and do not constitute, financial, investment, trading, or other types of advice or recommendations supplied or endorsed by TradingView. Read more in the Terms of Use.
Disclaimer
The information and publications are not meant to be, and do not constitute, financial, investment, trading, or other types of advice or recommendations supplied or endorsed by TradingView. Read more in the Terms of Use.