
📊 Current Price Context
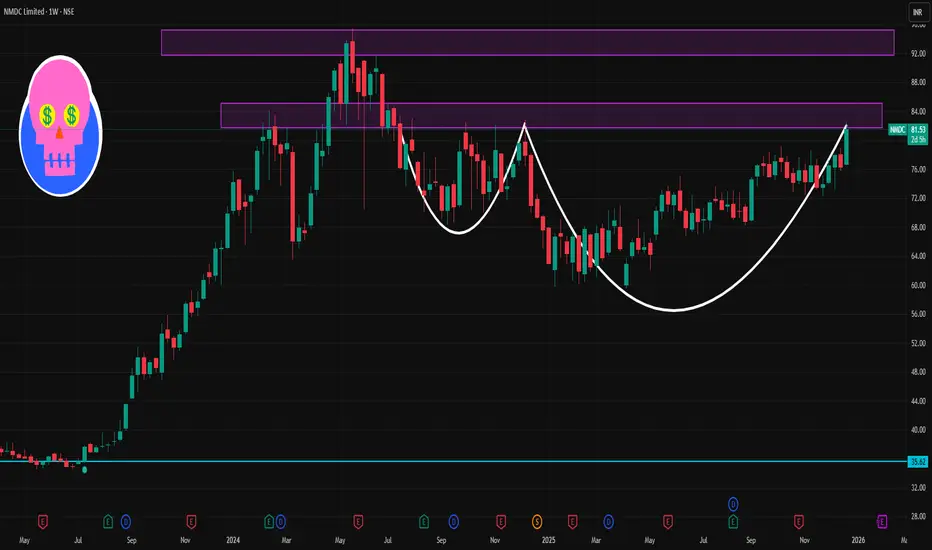
NMDC is trading around ₹81–₹82 on NSE currently.
📉 Weekly Support Levels
1. Primary Support: ~₹79–₹77 zone
Weekly pivot region and short‑term support clustered here.
2. Next Support: ~₹76–₹74 region
A key technical support band on weekly charts and potential “re‑entry” level if near‑term support breaks.
3. Lower Support Floor: ~₹69–₹68 (longer weekly support)
If the ₹74 region fails decisively, the next significant weekly demand zone is here.
📈 Weekly Resistance Levels
1. Immediate Resistance: ~₹82–₹83
Near the current trading range high and recent pivot resistance.
2. Higher Resistance: ~₹84–₹86
Represents a zone where weekly price has previously stalled.
3. Major Breakout Level: Above ₹88‑₹90
Crossing and closing above this weekly zone can signal stronger bullish continuation.
📌 Trading Tip:
Bullish view: Weekly close above ₹82–₹83 strengthens upside potential.
Bearish risk: Weekly break below ₹76–₹74 weakens structure and could target lower supports.
NMDC is trading around ₹81–₹82 on NSE currently.
📉 Weekly Support Levels
1. Primary Support: ~₹79–₹77 zone
Weekly pivot region and short‑term support clustered here.
2. Next Support: ~₹76–₹74 region
A key technical support band on weekly charts and potential “re‑entry” level if near‑term support breaks.
3. Lower Support Floor: ~₹69–₹68 (longer weekly support)
If the ₹74 region fails decisively, the next significant weekly demand zone is here.
📈 Weekly Resistance Levels
1. Immediate Resistance: ~₹82–₹83
Near the current trading range high and recent pivot resistance.
2. Higher Resistance: ~₹84–₹86
Represents a zone where weekly price has previously stalled.
3. Major Breakout Level: Above ₹88‑₹90
Crossing and closing above this weekly zone can signal stronger bullish continuation.
📌 Trading Tip:
Bullish view: Weekly close above ₹82–₹83 strengthens upside potential.
Bearish risk: Weekly break below ₹76–₹74 weakens structure and could target lower supports.

Contact Knowledgehub for a detailed consultation: Dm on WhatsApp: [wa.link/a2o0kz]-
Phone No: [+91 93102 26243]-
Email: [tradingviewknowledgehub@gmail.com]---
-- Let’s achieve success together!
Phone No: [+91 93102 26243]-
Email: [tradingviewknowledgehub@gmail.com]---
-- Let’s achieve success together!
Related publications
Disclaimer
The information and publications are not meant to be, and do not constitute, financial, investment, trading, or other types of advice or recommendations supplied or endorsed by TradingView. Read more in the Terms of Use.
Contact Knowledgehub for a detailed consultation: Dm on WhatsApp: [wa.link/a2o0kz]-
Phone No: [+91 93102 26243]-
Email: [tradingviewknowledgehub@gmail.com]---
-- Let’s achieve success together!
Phone No: [+91 93102 26243]-
Email: [tradingviewknowledgehub@gmail.com]---
-- Let’s achieve success together!
Related publications
Disclaimer
The information and publications are not meant to be, and do not constitute, financial, investment, trading, or other types of advice or recommendations supplied or endorsed by TradingView. Read more in the Terms of Use.