
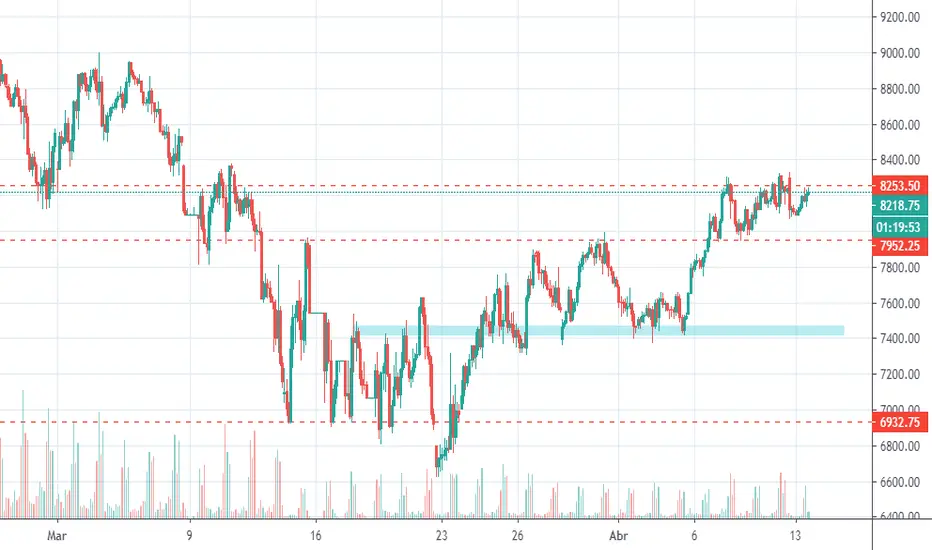
En el siguiente gráfico comparto zonas de soportes y resistencias operativas, eso no quiere decir que se compre sobre un soporte o se venda sobre la resistencia, cada uno según su análisis de proyección tomara decisiones sobre las diferentes zonas.

Disclaimer
The information and publications are not meant to be, and do not constitute, financial, investment, trading, or other types of advice or recommendations supplied or endorsed by TradingView. Read more in the Terms of Use.
Disclaimer
The information and publications are not meant to be, and do not constitute, financial, investment, trading, or other types of advice or recommendations supplied or endorsed by TradingView. Read more in the Terms of Use.