
First off, I want to thank everyone for all the support on my last NVDA markup. You all showed so much love and support. Something that may seem small to some was actually a big highlight for me in my journey, and having my community behind me really meant a lot.
So again—thank you. 🙏
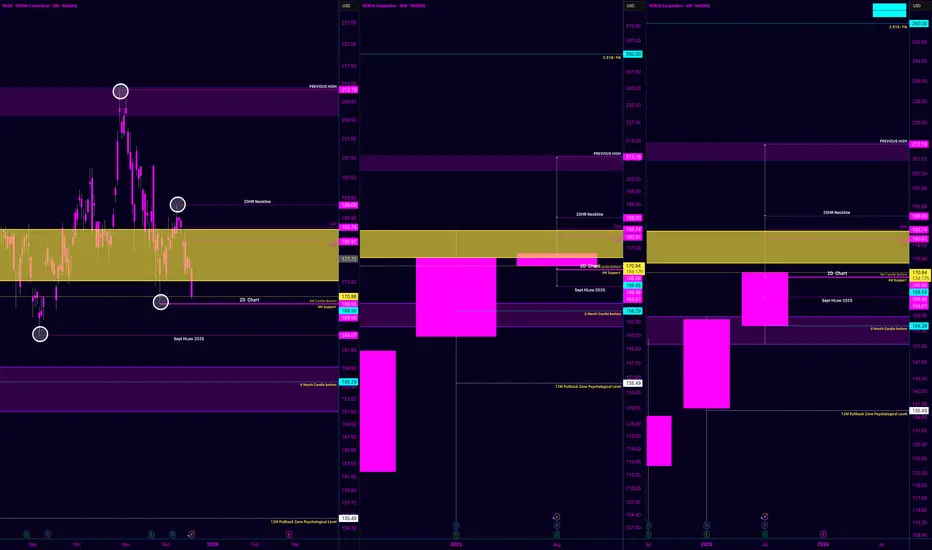
This is how I see NVDA right now, stripping out the noise and focusing purely on structure.
The Impulse That Matters
We put in a clean low at 164.07 and ran all the way up to 212.xx.
That move wasn’t random. It was strong, decisive, and directional — the kind of move that sets the tone for everything that comes after it.
For me, that leg defines the range I care about. Everything since then is just price working off that expansion.
The Pullback (Not a Breakdown)
After topping near 212, price pulled back into 169.56.
I don’t see that as weakness — I see it as digestion.
That pullback:
Stayed within higher-timeframe structure
Respected prior acceptance
Never turned into a clean bearish impulse
So structurally, the trend didn’t break. It just paused.
The Neckline / Balance Area
The zone from 169.56 to 188 is the key area for me.
This range has:
Multiple reactions
Overlapping candles
Clear acceptance from both sides
That tells me this isn’t trend failure — it’s balance.
This is where the market is deciding whether it’s ready to continue or needs more time.
That’s why I call it the neckline.
Where We Are Now (Second Retest) MOST IMPORTANT
Price pushed back toward 188, couldn’t hold it, and rotated back down into the 170+ area.
To me, this looks like a second retest, not a breakdown.
Markets rarely resolve on the first touch.
They test, rotate, absorb — then decide.
As long as we’re holding above 169.56, I see this as price revisiting the base before making its next move.
The Big Picture (Why I’m Still Calm)
So in my head, the structure is simple:
164.07 → 212.xx: Expansion
212.xx → 169.56: Pullback
169.56 → 188: Balance / neckline
188 → 170+: Second retest
Nothing about that sequence screams “trend failure” to me.
This is the market doing what markets do after a big move — slowing down, shaking out impatience, and testing conviction.
I’m not trying to predict the next candle that is not my focus
I’m watching whether structure holds and so far , it has.
If 169.56 holds, the higher-timeframe story stays intact ( 6 Month Time frame/ Candle just looks healthy to me) If it doesn’t, then I reassess — not emotionally, just structurally.
That’s it. No hype. No fear. Just price doing its thing and that why im staying call during this time.

Related publications
Disclaimer
The information and publications are not meant to be, and do not constitute, financial, investment, trading, or other types of advice or recommendations supplied or endorsed by TradingView. Read more in the Terms of Use.
Related publications
Disclaimer
The information and publications are not meant to be, and do not constitute, financial, investment, trading, or other types of advice or recommendations supplied or endorsed by TradingView. Read more in the Terms of Use.