📈 Heikin Ashi Trend Continuation & Weakness Framework
⸻⸻⸻⸻⸻⸻⸻⸻⸻⸻
📊 Key Observations
⸻⸻⸻⸻⸻⸻⸻⸻⸻⸻
📊 Chart Explanation
⸻⸻⸻⸻⸻⸻⸻⸻⸻⸻
📘 How to Use Heikin Ashi Effectively
⸻⸻⸻⸻⸻⸻⸻⸻⸻⸻
⚠️ Disclaimer
This chart demonstrates how Heikin Ashi candles simplify trend analysis by filtering out market noise and emphasizing directional strength, momentum, and trend exhaustion.
Unlike standard candlesticks, Heikin Ashi focuses on average price behavior, making it ideal for:
- Trend identification
- Staying in strong moves
- Avoiding premature reversals
This framework is designed to ride trends, not predict tops or bottoms.
⸻⸻⸻⸻⸻⸻⸻⸻⸻⸻
📊 Key Observations
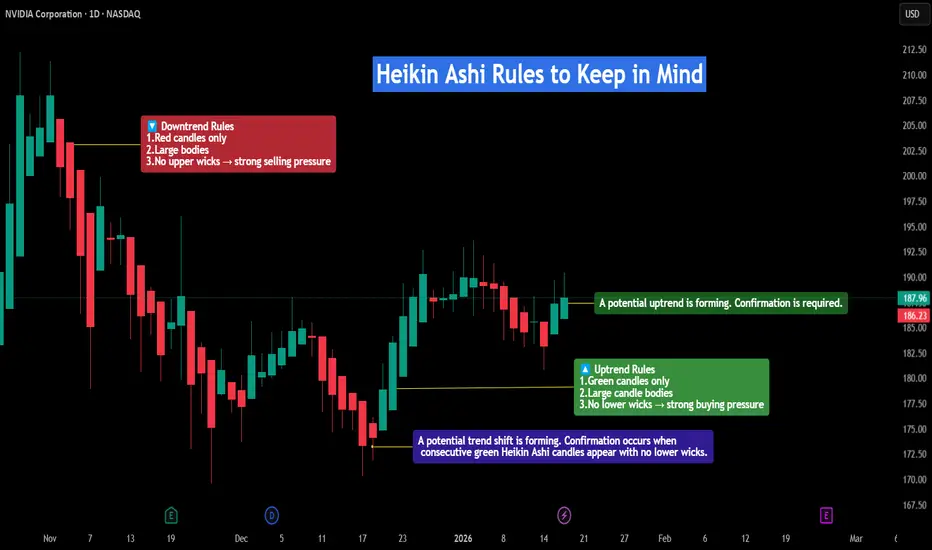
1️⃣ Heikin Ashi Downtrend Rules (Bearish Control)
A strong downtrend is defined by:
- Red candles only
- Large candle bodies
- No upper wicks → strong selling pressure
This structure indicates aggressive sellers with minimal pullback.
As long as these conditions persist, short bias remains dominant.
2️⃣ Trend Weakness Signals (Transition Phase)
Trend weakness appears when:
- Candle bodies shrink
- Upper and lower wicks start appearing
- Heikin Ashi Doji candles form
⚠️ Important:
Heikin Ashi dojis do not signal an instant reversal.
They indicate loss of momentum and balance between buyers and sellers.
This phase often leads to:
- Consolidation
- Range formation
- Or a slow trend transition
3️⃣ Structure Shift & Early Bullish Signs
After bearish momentum fades:
- Red candles stop expanding
- First green Heikin Ashi candles appear
- Bodies are small → confirmation still pending
At this stage:
A potential uptrend is forming, but confirmation is required.
This prevents early long entries during false reversals.
4️⃣ Heikin Ashi Uptrend Rules (Bullish Control)
A confirmed bullish trend requires:
- Green candles only
- Large candle bodies
- No lower wicks → strong buying pressure
This structure signals:
- Aggressive buyers
- Shallow pullbacks
- High probability continuation
As long as these conditions hold, trend-following longs are favored.
5️⃣ Trend Continuation Logic
The strongest Heikin Ashi trends follow this sequence:
- One-directional candles
- Increasing body size
- Minimal or no opposite wicks
This allows traders to:
- Stay in winning trades longer
- Avoid overtrading
- Let trends mature fully
6️⃣ What Breaks the Trend?
A Heikin Ashi trend weakens when:
- Opposite-colored candles appear
- Wicks form against the trend
- Candle bodies consistently shrink
Only multiple confirmations should be used to assume a trend change — not a single candle.
⸻⸻⸻⸻⸻⸻⸻⸻⸻⸻
📊 Chart Explanation
Symbol →NVDA
Timeframe → 1D
This chart highlights:
- Clean bearish phase using red HA candles
- Momentum loss via doji candles
- Transition into bullish structure
- Confirmed uptrend with green candles & no lower wicks
Expected Sequence:
trend → momentum loss → transition → confirmation → continuation
Heikin Ashi excels at trend clarity, not precision entries.
⸻⸻⸻⸻⸻⸻⸻⸻⸻⸻
📘 How to Use Heikin Ashi Effectively
🔹 Trend-Following Use
Trade only in the direction of candle color
Stay in trades until opposite structure appears
Ignore small pullbacks during strong trends
🔹 Risk Management Tip
Use normal candles for exact entries if needed
Use Heikin Ashi for trend bias and holding trades
🔹 Common Mistake
❌ Treating doji candles as reversal signals
✅ Treating them as trend weakness alerts
⸻⸻⸻⸻⸻⸻⸻⸻⸻⸻
⚠️ Disclaimer
📘 For educational purposes only
🙅 Not SEBI registered
❌ Not financial or investment advice

Pine Script Developer • Market Analysis
Disclaimer
The information and publications are not meant to be, and do not constitute, financial, investment, trading, or other types of advice or recommendations supplied or endorsed by TradingView. Read more in the Terms of Use.
Pine Script Developer • Market Analysis
Disclaimer
The information and publications are not meant to be, and do not constitute, financial, investment, trading, or other types of advice or recommendations supplied or endorsed by TradingView. Read more in the Terms of Use.