
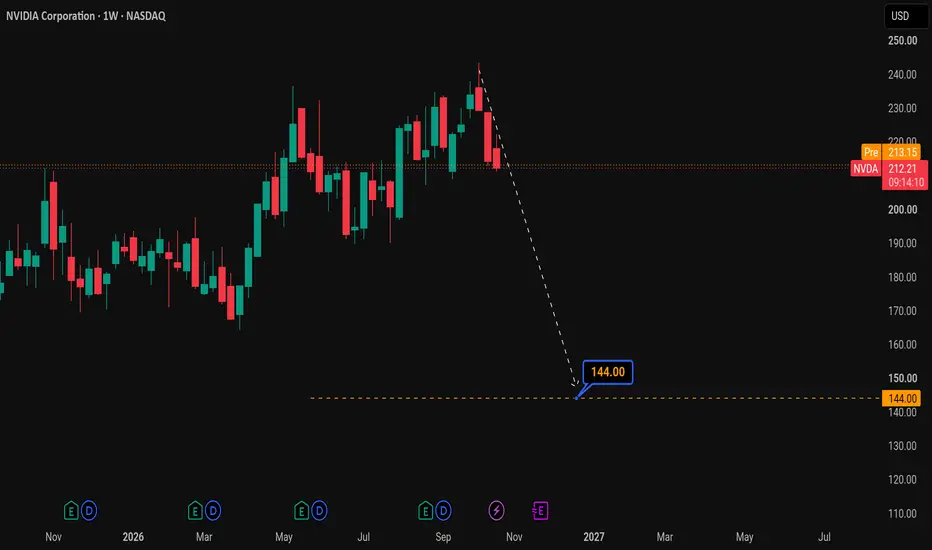
NVDA 1W: Projected Bearish Correction Targeting Primary Support Baseline
• Ticker: NVDA (NVIDIA Corporation) via NASDAQ
• Timeframe: 1-Weekly (1W)
• Current Price: 212.21 USD (-1.92 / -0.90%)
Key Technical Levels
• Overhead Resistance Ceiling: 240.00 USD (Recent multi-week swing high rejection zone).
• Intermediate Macro Shelf: 200.00 USD (Psychological level and previous structural consolidation area).
• Defined Major Support Target: 144.00 USD (The major long-term structural floor marked by the baseline label on the chart).
Market Analysis & Structural Outlook
• Price Action: After experiencing a definitive rejection at the recent structural peak near 240.00 USD, NVIDIA has broken below its immediate bullish distribution structure on the macro weekly chart.
• Current Framework: The asset is demonstrating a structural rollover pattern with expanding weekly bearish candlesticks. The immediate market mechanics indicate a loss of buyer momentum, favoring a sustained corrective cycle over the coming months.
• Execution Projection: The technical projection path highlights a multi-week downward drift. If the active selling pressure remains unabsorbed by the market at intermediate levels, price action is structurally projected to expand down toward the major macro demand pool resting around the 144.00 USD historical baseline.
Legal Compliance & Financial Disclaimer
This technical analysis is published strictly for educational, illustrative, and case-study purposes only. It does not constitute financial, investment, trading, legal, or tax advice, nor does it serve as a professional solicitation to buy or sell securities. Equities and derivative instruments carry a high level of market risk, including the potential loss of principal capital. The author is not a registered investment advisor, licensed broker, or certified financial analyst. Past performance or technical projection pathways do not guarantee or dictate future market results. All traders must perform independent research, utilize disciplined risk management frameworks, and consult a certified financial advisor before risking real capital in live financial markets. The author assumes zero liability for any financial losses incurred directly or indirectly from the use of this technical analysis.

Disclaimer
The information and publications are not meant to be, and do not constitute, financial, investment, trading, or other types of advice or recommendations supplied or endorsed by TradingView. Read more in the Terms of Use.
Disclaimer
The information and publications are not meant to be, and do not constitute, financial, investment, trading, or other types of advice or recommendations supplied or endorsed by TradingView. Read more in the Terms of Use.