

1️⃣ Higher-Timeframe Context
Market has been in a descending channel since mid-year
Momentum to the downside is weakening
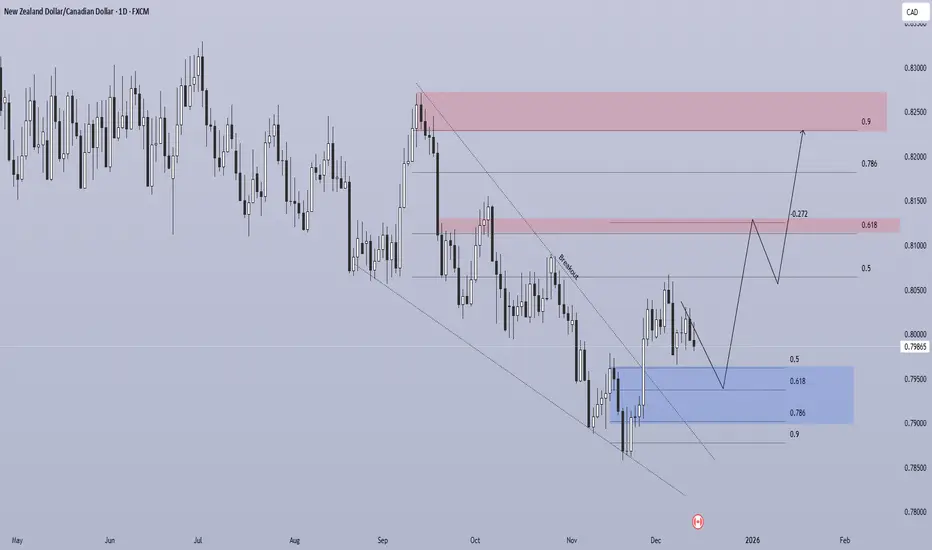
Price has broken the descending trendline, signaling early trend shift
This suggests we are in an early reversal / accumulation phase, not yet a confirmed uptrend.
2️⃣ Market Structure & Price Action
🔹 Trendline Breakout
Clear breakout above the descending trendline
Price is now retesting the breakout zone, which is constructive
🔹 Demand / Accumulation Zone (Blue)
Approx. 0.7900 – 0.7950
Confluence of:
Fibonacci 0.618 – 0.786
Prior structure support
Liquidity absorption
This zone acts as a Last Point of Support (LPS).
3️⃣ Fibonacci & Liquidity Framework
🔵 Below Price
0.9 retracement has been fully swept
Limited sell-side liquidity remains below current price
🔴 Above Price (Liquidity Targets)
0.8050 → 0.5 retracement (intermediate resistance)
0.8120 – 0.8150 → 0.618 + -0.272 extension (key reaction zone)
0.8200 → 0.786 retracement
0.8250 → 0.9 retracement (major liquidity pool)
Liquidity is clearly stacked above price, favoring upside continuation.
4️⃣ Expected Price Path (Primary Scenario)
Price holds above 0.7900
Forms a higher low inside the blue demand zone
Pushes toward 0.8050
Shallow pullback (bullish continuation)
Expansion toward:
0.8120 – 0.8150
0.8200
0.8250 (main target)
This aligns with a Wyckoff accumulation → Phase D markup.
Market has been in a descending channel since mid-year
Momentum to the downside is weakening
Price has broken the descending trendline, signaling early trend shift
This suggests we are in an early reversal / accumulation phase, not yet a confirmed uptrend.
2️⃣ Market Structure & Price Action
🔹 Trendline Breakout
Clear breakout above the descending trendline
Price is now retesting the breakout zone, which is constructive
🔹 Demand / Accumulation Zone (Blue)
Approx. 0.7900 – 0.7950
Confluence of:
Fibonacci 0.618 – 0.786
Prior structure support
Liquidity absorption
This zone acts as a Last Point of Support (LPS).
3️⃣ Fibonacci & Liquidity Framework
🔵 Below Price
0.9 retracement has been fully swept
Limited sell-side liquidity remains below current price
🔴 Above Price (Liquidity Targets)
0.8050 → 0.5 retracement (intermediate resistance)
0.8120 – 0.8150 → 0.618 + -0.272 extension (key reaction zone)
0.8200 → 0.786 retracement
0.8250 → 0.9 retracement (major liquidity pool)
Liquidity is clearly stacked above price, favoring upside continuation.
4️⃣ Expected Price Path (Primary Scenario)
Price holds above 0.7900
Forms a higher low inside the blue demand zone
Pushes toward 0.8050
Shallow pullback (bullish continuation)
Expansion toward:
0.8120 – 0.8150
0.8200
0.8250 (main target)
This aligns with a Wyckoff accumulation → Phase D markup.

✅FREE FOREX &CRYPTO SIGNALS TELEGRAM CHANNEL:
t.me/winlouhscalperchannel
t.me/winlouhscalperchannel
Disclaimer
The information and publications are not meant to be, and do not constitute, financial, investment, trading, or other types of advice or recommendations supplied or endorsed by TradingView. Read more in the Terms of Use.
✅FREE FOREX &CRYPTO SIGNALS TELEGRAM CHANNEL:
t.me/winlouhscalperchannel
t.me/winlouhscalperchannel
Disclaimer
The information and publications are not meant to be, and do not constitute, financial, investment, trading, or other types of advice or recommendations supplied or endorsed by TradingView. Read more in the Terms of Use.