

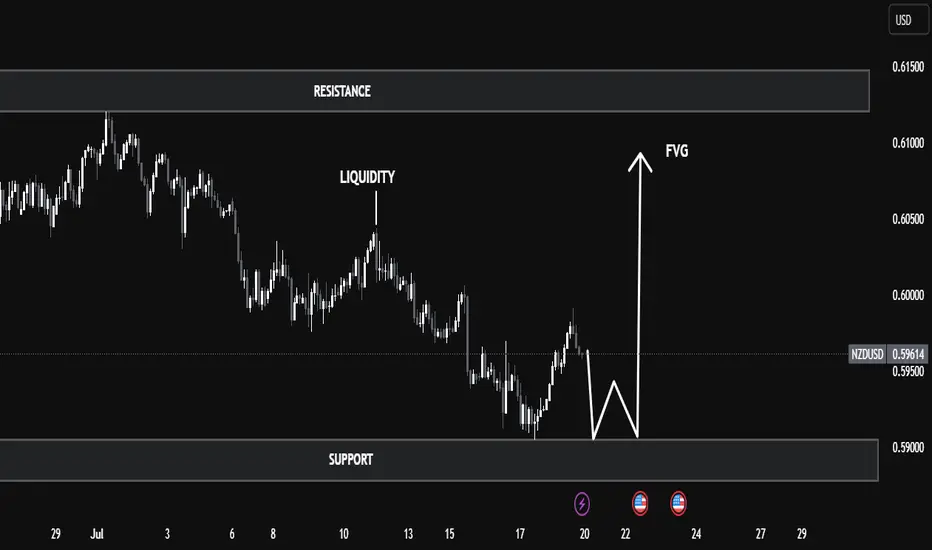
🧠 NZD/USD Technical Analysis | Smart Money Perspective
Currently, the NZD/USD pair is trading around 0.5960, positioned between a well-defined resistance zone (0.6130–0.6150) and a support zone (0.5890–0.5900).
Here are the key technical aspects to note:
🔹 1. Liquidity Sweep
The price recently dipped below the previous swing low near 0.5900, tapping into a pool of sell-side liquidity. This move is typically seen as a liquidity grab, where institutional players push the price to trigger retail stop losses before reversing direction.
🔹 2. Double Bottom Formation
The chart suggests a potential double bottom forming at the support level — a classic sign of accumulation. This pattern indicates buyers may be coming in after liquidity has been cleared, expecting a reversal.
🔹 3. Fair Value Gap (FVG)
A Fair Value Gap, or imbalance, is visible between 0.5985 and 0.6015. This gap was created due to a sharp bearish move, leaving price action unbalanced. The price is now likely to retrace into this area to rebalance orders, which is typical smart money behaviour.
🔹 4. Market Structure Outlook
If the double bottom confirms with a bullish break of structure above 0.5980, we could see a continuation towards:
- First Target: FVG zone around 0.6015
- Second Target: Major resistance near 0.6150, where past distribution occurred
✅ Conclusion
This setup integrates key smart money concepts:
- Liquidity grab below support
- Accumulation phase at demand
- FVG as a target
- Potential bullish shift in market structure
Traders should keep a close watch on price action around the support zone for confirmation, such as a bullish engulfing candle or a break of recent short-term highs, before taking long positions. Targets remain at the FVG and resistance zones; however, sound risk management is crucial in case of a deeper sweep or any macroeconomic developments.
Currently, the NZD/USD pair is trading around 0.5960, positioned between a well-defined resistance zone (0.6130–0.6150) and a support zone (0.5890–0.5900).
Here are the key technical aspects to note:
🔹 1. Liquidity Sweep
The price recently dipped below the previous swing low near 0.5900, tapping into a pool of sell-side liquidity. This move is typically seen as a liquidity grab, where institutional players push the price to trigger retail stop losses before reversing direction.
🔹 2. Double Bottom Formation
The chart suggests a potential double bottom forming at the support level — a classic sign of accumulation. This pattern indicates buyers may be coming in after liquidity has been cleared, expecting a reversal.
🔹 3. Fair Value Gap (FVG)
A Fair Value Gap, or imbalance, is visible between 0.5985 and 0.6015. This gap was created due to a sharp bearish move, leaving price action unbalanced. The price is now likely to retrace into this area to rebalance orders, which is typical smart money behaviour.
🔹 4. Market Structure Outlook
If the double bottom confirms with a bullish break of structure above 0.5980, we could see a continuation towards:
- First Target: FVG zone around 0.6015
- Second Target: Major resistance near 0.6150, where past distribution occurred
✅ Conclusion
This setup integrates key smart money concepts:
- Liquidity grab below support
- Accumulation phase at demand
- FVG as a target
- Potential bullish shift in market structure
Traders should keep a close watch on price action around the support zone for confirmation, such as a bullish engulfing candle or a break of recent short-term highs, before taking long positions. Targets remain at the FVG and resistance zones; however, sound risk management is crucial in case of a deeper sweep or any macroeconomic developments.

Disclaimer
The information and publications are not meant to be, and do not constitute, financial, investment, trading, or other types of advice or recommendations supplied or endorsed by TradingView. Read more in the Terms of Use.
Disclaimer
The information and publications are not meant to be, and do not constitute, financial, investment, trading, or other types of advice or recommendations supplied or endorsed by TradingView. Read more in the Terms of Use.