
**💼 ONE POINT ONE SOLUTIONS: Weekly Chart Breakdown**
*Chart by RShivashankar | TradingView*
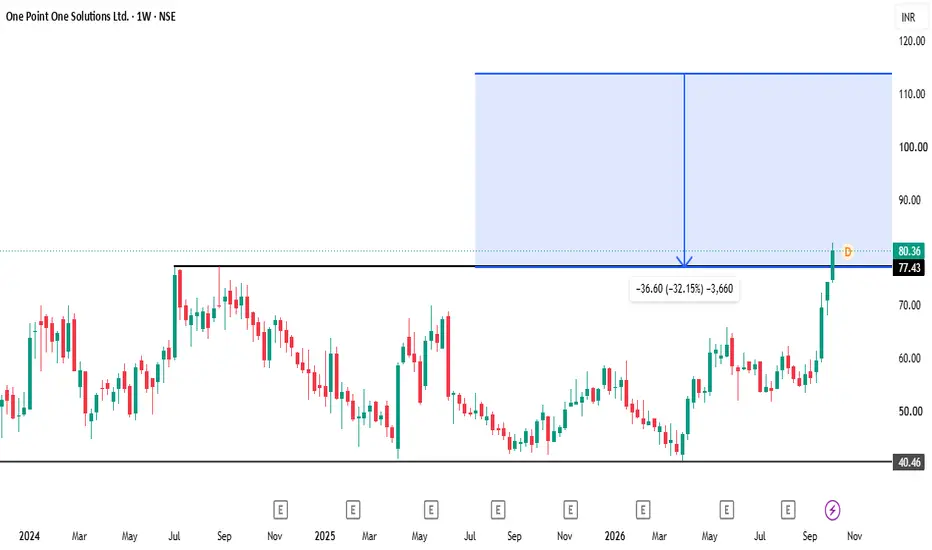
🕯️ **O:** 75.10 | **H:** 81.85 | **L:** 74.30 | **C:** 80.36
🚀 **+8.05%** (+₹5.99) on the week, a strong green candle closing near its highs
━━━━━━━━━━━━━━━━
**🔓 THE SETUP**
Price has been range-bound since 2024, with the ceiling around ₹77.43 rejecting it in mid-2024 and again in later swings. After bouncing off the ₹40.46 base in early 2026, it built a series of rising weekly candles and this week closed above that ceiling.
**🧱 KEY ZONES**
🔴 Multi-year resistance, now first support to watch: **~₹77.43**
🟢 Range base: **~₹40.46** (tested twice, in 2025 and early 2026 🛡️)
📦 A ~2.5-year range resolving to the upside
**⚠️ Points worth flagging to followers:**
- The close is only about ₹3 (roughly 4%) above the breakout level, so this is an early breakout that hasn't been tested yet. A retest of ₹77 is common
- The chart has no volume pane, so volume confirmation can't be assessed. Worth adding the volume indicator to your screenshot
- Four straight strong green weeks have pushed price up fast from the ₹55 area, so it's somewhat extended short term
**📐 HOW TO MAP YOUR OWN LEVELS**
*(method only, plug in your own risk tolerance)*
1️⃣ **Measured Move:** Range height (₹77.43 − ₹40.46 ≈ ₹37) projected from the breakout point → reference extension zone above ₹77.43
2️⃣ **Swing-High Zones:** This week's high (₹81.85) is the immediate level to clear
3️⃣ **Stop-Loss Logic:** Below the ₹77.43 breakout zone, or below this week's low (₹74.30) for a tighter reference
4️⃣ **Trailing Rule:** Trail below each new rising weekly swing low as the trend extends
**🔊 CONFIRMATION SIGNS TO WATCH**
✅ Weekly close holding above ₹77.43, ideally a successful retest
✅ Weekly close above ₹81.85 for continuation
⚠️ Weekly close back below ₹77.43 = breakout failure, structure in question
━━━━━━━━━━━━━━━━
⚠️ **Educational chart analysis only, not investment advice. Not a target/SL recommendation. Please do your own research and consult a registered advisor before trading. Trading involves risk of capital loss.**
---
*Chart by RShivashankar | TradingView*
🕯️ **O:** 75.10 | **H:** 81.85 | **L:** 74.30 | **C:** 80.36
🚀 **+8.05%** (+₹5.99) on the week, a strong green candle closing near its highs
━━━━━━━━━━━━━━━━
**🔓 THE SETUP**
Price has been range-bound since 2024, with the ceiling around ₹77.43 rejecting it in mid-2024 and again in later swings. After bouncing off the ₹40.46 base in early 2026, it built a series of rising weekly candles and this week closed above that ceiling.
**🧱 KEY ZONES**
🔴 Multi-year resistance, now first support to watch: **~₹77.43**
🟢 Range base: **~₹40.46** (tested twice, in 2025 and early 2026 🛡️)
📦 A ~2.5-year range resolving to the upside
**⚠️ Points worth flagging to followers:**
- The close is only about ₹3 (roughly 4%) above the breakout level, so this is an early breakout that hasn't been tested yet. A retest of ₹77 is common
- The chart has no volume pane, so volume confirmation can't be assessed. Worth adding the volume indicator to your screenshot
- Four straight strong green weeks have pushed price up fast from the ₹55 area, so it's somewhat extended short term
**📐 HOW TO MAP YOUR OWN LEVELS**
*(method only, plug in your own risk tolerance)*
1️⃣ **Measured Move:** Range height (₹77.43 − ₹40.46 ≈ ₹37) projected from the breakout point → reference extension zone above ₹77.43
2️⃣ **Swing-High Zones:** This week's high (₹81.85) is the immediate level to clear
3️⃣ **Stop-Loss Logic:** Below the ₹77.43 breakout zone, or below this week's low (₹74.30) for a tighter reference
4️⃣ **Trailing Rule:** Trail below each new rising weekly swing low as the trend extends
**🔊 CONFIRMATION SIGNS TO WATCH**
✅ Weekly close holding above ₹77.43, ideally a successful retest
✅ Weekly close above ₹81.85 for continuation
⚠️ Weekly close back below ₹77.43 = breakout failure, structure in question
━━━━━━━━━━━━━━━━
⚠️ **Educational chart analysis only, not investment advice. Not a target/SL recommendation. Please do your own research and consult a registered advisor before trading. Trading involves risk of capital loss.**
---

Disclaimer
The information and publications are not meant to be, and do not constitute, financial, investment, trading, or other types of advice or recommendations supplied or endorsed by TradingView. Read more in the Terms of Use.
Disclaimer
The information and publications are not meant to be, and do not constitute, financial, investment, trading, or other types of advice or recommendations supplied or endorsed by TradingView. Read more in the Terms of Use.