
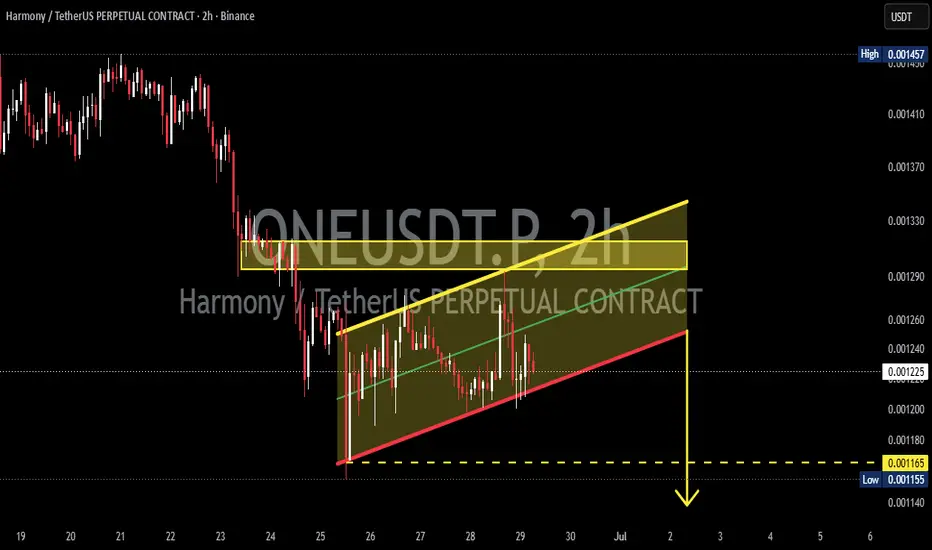
On the 2-hour timeframe, ONEUSDT is still trading within a Bear Flag structure, a classic bearish continuation pattern that forms after a sharp decline (flagpole), followed by a temporary consolidation inside an ascending channel.
At the moment, price is moving within the ascending channel (the flag), while the horizontal resistance zone (🟨 yellow box) continues to act as a strong barrier that buyers have failed to break. This suggests that buyers are attempting a recovery, but sellers remain in control as long as price stays below this resistance.
📌 Overall, the market structure continues to favor a bearish continuation unless a confirmed breakout occurs with increasing trading volume.
---
🚩📉 Bear Flag Pattern
A Bear Flag is a bearish continuation pattern consisting of two main phases:
🔻 Flagpole
- A strong and impulsive price decline driven by dominant selling pressure.
🏳️ Flag
- A temporary consolidation or gradual upward movement within an ascending channel before the primary downtrend resumes.
📍 In this chart:
✅ The flagpole has already formed clearly.
✅ Price is currently consolidating inside an ascending channel.
✅ The 🟨 horizontal resistance zone further reinforces selling pressure.
📌 As long as price remains below this resistance area, the Bear Flag pattern remains valid.
---
🟢 Bullish Scenario
A bullish confirmation would require:
✅ Price breaks above the upper trendline of the Bear Flag.
✅ The breakout also clears the horizontal resistance zone (🟨 yellow box).
✅ A strong candle closes above the breakout level with increasing trading volume. 📈
🚀 If all these conditions are met, the Bear Flag could fail (Bear Trap), opening the door for a bullish continuation toward the next resistance levels.
⚠️ However, until a confirmed breakout occurs, any upward movement should still be considered a potential relief rally.
---
🔴 Bearish Scenario
The primary outlook remains in favor of the sellers.
A stronger bearish confirmation would occur if:
✅ Price loses the ascending trendline support.
✅ A breakdown is confirmed with a candle closing below support.
✅ Selling volume increases during the breakdown. 📉
🎯 If these conditions are met, the Bear Flag pattern would be confirmed, increasing the probability of a continuation toward the next support zone, including a retest of the previous low around 0.001165, or even lower if selling pressure continues to intensify.
---
🎯 Key Levels to Watch
🟨 Resistance
🔸 Horizontal Resistance Zone (Yellow Box)
🔸 Upper Bear Flag Trendline
🟥 Support
🔹 Lower Bear Flag Trendline
🔹 Support Area around 0.001165
---
📌⚠️ Conclusion
The current ONEUSDT structure continues to display a valid Bear Flag pattern. Although price is moving inside an ascending channel, this formation is more likely to represent a temporary consolidation before a potential continuation of the broader downtrend.
📉 As long as the major resistance remains intact, the probability continues to favor the bearish continuation scenario.
💡 Traders are advised to wait for a confirmed breakout or breakdown before making trading decisions in order to avoid false signals.
«⚡ "Trade the confirmation, not the prediction."»
---
#ONEUSDT #ONE #BearFlag #Crypto #Cryptocurrency #TechnicalAnalysis #PriceAction #Altcoins #CryptoTrading #Support #Resistance #Breakdown #Breakout #ChartAnalysis #Trader #Bearish #Bullish #RiskManagement
At the moment, price is moving within the ascending channel (the flag), while the horizontal resistance zone (🟨 yellow box) continues to act as a strong barrier that buyers have failed to break. This suggests that buyers are attempting a recovery, but sellers remain in control as long as price stays below this resistance.
📌 Overall, the market structure continues to favor a bearish continuation unless a confirmed breakout occurs with increasing trading volume.
---
🚩📉 Bear Flag Pattern
A Bear Flag is a bearish continuation pattern consisting of two main phases:
🔻 Flagpole
- A strong and impulsive price decline driven by dominant selling pressure.
🏳️ Flag
- A temporary consolidation or gradual upward movement within an ascending channel before the primary downtrend resumes.
📍 In this chart:
✅ The flagpole has already formed clearly.
✅ Price is currently consolidating inside an ascending channel.
✅ The 🟨 horizontal resistance zone further reinforces selling pressure.
📌 As long as price remains below this resistance area, the Bear Flag pattern remains valid.
---
🟢 Bullish Scenario
A bullish confirmation would require:
✅ Price breaks above the upper trendline of the Bear Flag.
✅ The breakout also clears the horizontal resistance zone (🟨 yellow box).
✅ A strong candle closes above the breakout level with increasing trading volume. 📈
🚀 If all these conditions are met, the Bear Flag could fail (Bear Trap), opening the door for a bullish continuation toward the next resistance levels.
⚠️ However, until a confirmed breakout occurs, any upward movement should still be considered a potential relief rally.
---
🔴 Bearish Scenario
The primary outlook remains in favor of the sellers.
A stronger bearish confirmation would occur if:
✅ Price loses the ascending trendline support.
✅ A breakdown is confirmed with a candle closing below support.
✅ Selling volume increases during the breakdown. 📉
🎯 If these conditions are met, the Bear Flag pattern would be confirmed, increasing the probability of a continuation toward the next support zone, including a retest of the previous low around 0.001165, or even lower if selling pressure continues to intensify.
---
🎯 Key Levels to Watch
🟨 Resistance
🔸 Horizontal Resistance Zone (Yellow Box)
🔸 Upper Bear Flag Trendline
🟥 Support
🔹 Lower Bear Flag Trendline
🔹 Support Area around 0.001165
---
📌⚠️ Conclusion
The current ONEUSDT structure continues to display a valid Bear Flag pattern. Although price is moving inside an ascending channel, this formation is more likely to represent a temporary consolidation before a potential continuation of the broader downtrend.
📉 As long as the major resistance remains intact, the probability continues to favor the bearish continuation scenario.
💡 Traders are advised to wait for a confirmed breakout or breakdown before making trading decisions in order to avoid false signals.
«⚡ "Trade the confirmation, not the prediction."»
---
#ONEUSDT #ONE #BearFlag #Crypto #Cryptocurrency #TechnicalAnalysis #PriceAction #Altcoins #CryptoTrading #Support #Resistance #Breakdown #Breakout #ChartAnalysis #Trader #Bearish #Bullish #RiskManagement

✅ Get Free Signals! Join Our Telegram Channel Here: t.me/TheCryptoNuclear
✅ Twitter: twitter.com/crypto_nuclear
✅ Join Bybit : partner.bybit.com/b/nuclearvip
✅ Benefits : Lifetime Trading Fee Discount -50%
✅ Twitter: twitter.com/crypto_nuclear
✅ Join Bybit : partner.bybit.com/b/nuclearvip
✅ Benefits : Lifetime Trading Fee Discount -50%
Disclaimer
The information and publications are not meant to be, and do not constitute, financial, investment, trading, or other types of advice or recommendations supplied or endorsed by TradingView. Read more in the Terms of Use.
✅ Get Free Signals! Join Our Telegram Channel Here: t.me/TheCryptoNuclear
✅ Twitter: twitter.com/crypto_nuclear
✅ Join Bybit : partner.bybit.com/b/nuclearvip
✅ Benefits : Lifetime Trading Fee Discount -50%
✅ Twitter: twitter.com/crypto_nuclear
✅ Join Bybit : partner.bybit.com/b/nuclearvip
✅ Benefits : Lifetime Trading Fee Discount -50%
Disclaimer
The information and publications are not meant to be, and do not constitute, financial, investment, trading, or other types of advice or recommendations supplied or endorsed by TradingView. Read more in the Terms of Use.