
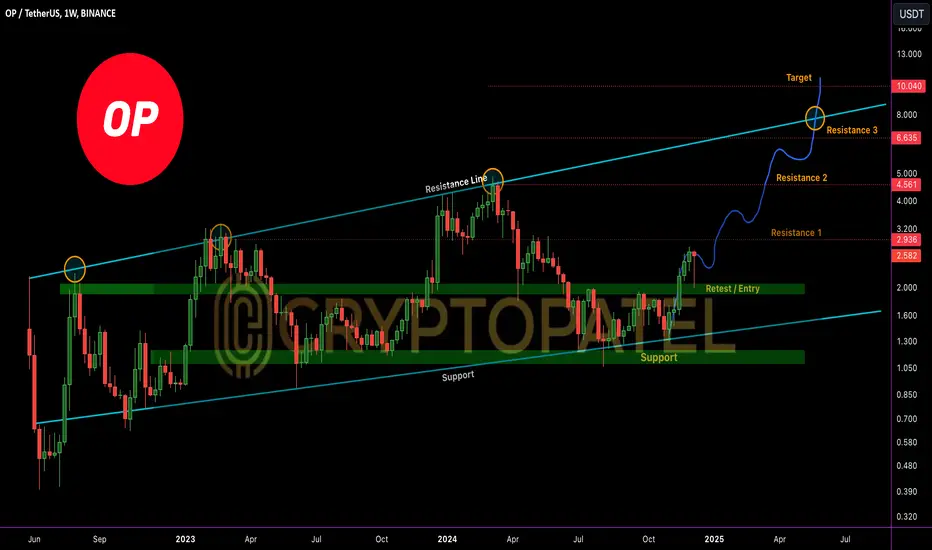
OP/USDT Technical Analysis - Potential Bullish Trend Ahead
The OP/USDT chart shows promising upward potential. Currently, OP is holding at a key support zone near $2.10, with a potential retest and entry point around this level.
Resistance Levels: $2.94/$4.56/$6.64
High Risk Target: $10
Trade Setup: Enter near current support levels, targeting key resistance zones with a long-term bullish outlook.
Stay tuned for further updates.
The OP/USDT chart shows promising upward potential. Currently,
OP is holding at a key support zone near $2.10, with a potential retest and entry point around this level.Resistance Levels: $2.94/$4.56/$6.64
High Risk Target: $10
Trade Setup: Enter near current support levels, targeting key resistance zones with a long-term bullish outlook.
Stay tuned for further updates.

Twitter: twitter.com/CryptoPatel
Telegram: t.me/OfficialCryptoPatel
Instagram: instagram.com/cryptopatel?utm_medium=copy_link
Telegram: t.me/OfficialCryptoPatel
Instagram: instagram.com/cryptopatel?utm_medium=copy_link
Disclaimer
The information and publications are not meant to be, and do not constitute, financial, investment, trading, or other types of advice or recommendations supplied or endorsed by TradingView. Read more in the Terms of Use.