
1. Technical Overview & Structure
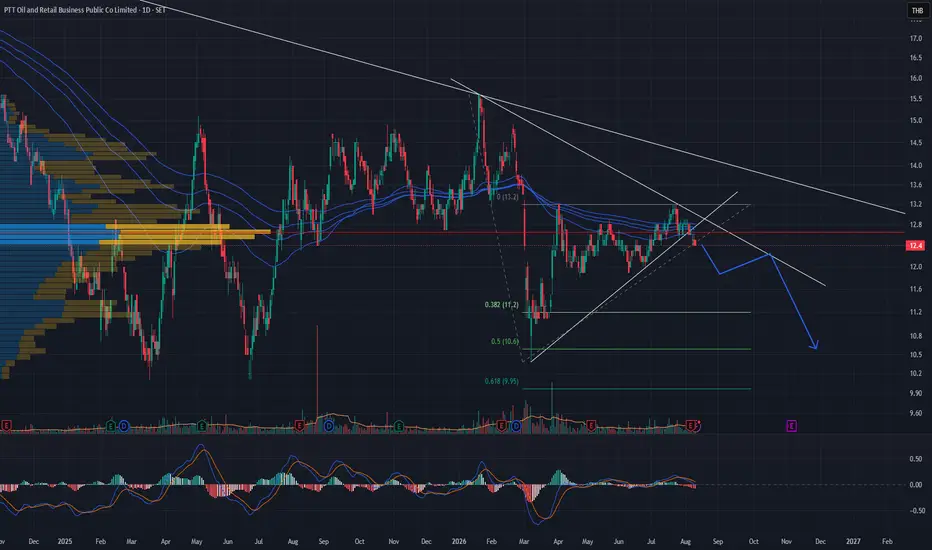
Macro Downtrend: Price action continues to operate within a broad macro descending structure, tightly capped by a long-term downward resistance line from prior highs.
Volume Profile & Accumulation Zone: A heavy concentration of High Volume Nodes sits in the lower range around 11.00 – 12.00, establishing a crucial structural demand floor and multi-month accumulation band.
Wedge / Triangle Compression: Price is consolidating within a converging range near historical support, reflecting a contraction in momentum as it approaches the apex. However, the projection path indicates a cautious outlook with a potential downside test toward structural support before any meaningful base is formed.
2. Key Price Targets (Fibonacci Retracement)
Short-Term Support Test (11.2): Aligned with the 0.382 Fibonacci Retracement level, serving as the immediate downside test level if the current consolidation range breaks lower.
Medium-Term Target (10.6): Corresponds to the 0.5 Fibonacci Retracement level, coming into play if broader selling pressure intensifies.
Deep Correction Target (9.95): Aligned with the 0.618 Fibonacci Retracement level, representing a deeper structural retracement toward macro demand clusters.
3. Risk Management
Invalidation Level / Resistance Break: A decisive bullish breakout above the upper descending trendline and moving average resistance cluster would invalidate this downside bias and signal a renewed trend reversal attempt.
Macro Downtrend: Price action continues to operate within a broad macro descending structure, tightly capped by a long-term downward resistance line from prior highs.
Volume Profile & Accumulation Zone: A heavy concentration of High Volume Nodes sits in the lower range around 11.00 – 12.00, establishing a crucial structural demand floor and multi-month accumulation band.
Wedge / Triangle Compression: Price is consolidating within a converging range near historical support, reflecting a contraction in momentum as it approaches the apex. However, the projection path indicates a cautious outlook with a potential downside test toward structural support before any meaningful base is formed.
2. Key Price Targets (Fibonacci Retracement)
Short-Term Support Test (11.2): Aligned with the 0.382 Fibonacci Retracement level, serving as the immediate downside test level if the current consolidation range breaks lower.
Medium-Term Target (10.6): Corresponds to the 0.5 Fibonacci Retracement level, coming into play if broader selling pressure intensifies.
Deep Correction Target (9.95): Aligned with the 0.618 Fibonacci Retracement level, representing a deeper structural retracement toward macro demand clusters.
3. Risk Management
Invalidation Level / Resistance Break: A decisive bullish breakout above the upper descending trendline and moving average resistance cluster would invalidate this downside bias and signal a renewed trend reversal attempt.

Disclaimer
The information and publications are not meant to be, and do not constitute, financial, investment, trading, or other types of advice or recommendations supplied or endorsed by TradingView. Read more in the Terms of Use.
Disclaimer
The information and publications are not meant to be, and do not constitute, financial, investment, trading, or other types of advice or recommendations supplied or endorsed by TradingView. Read more in the Terms of Use.