
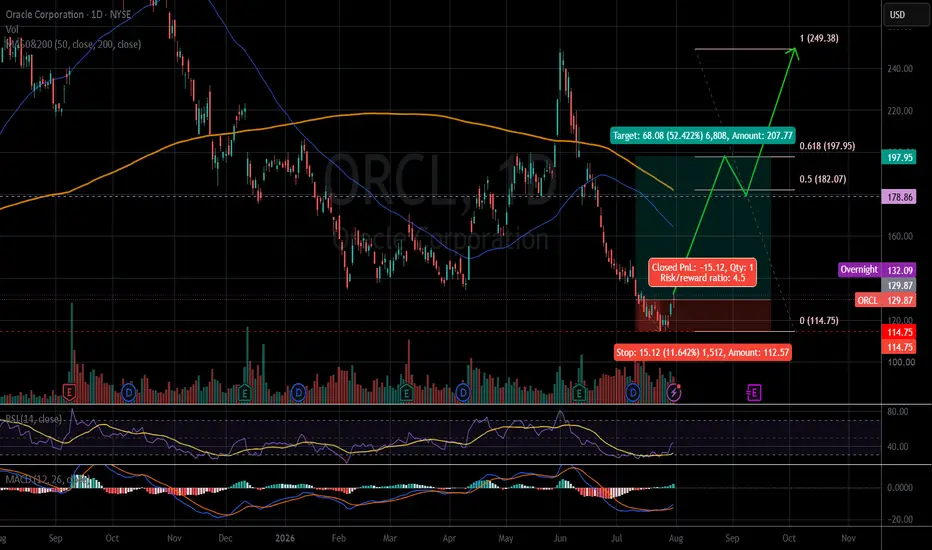
The weekly chart shows a bullish divergence with the RSI.
There were signs of a price increase last week, according to the RSI and MACD indicators.
The price closed on 07.31.2026: $129.87.
Price target: $197.95/ $249.38
Stop loss: $114.75 (-11.6%)
R/R: 4.5
IMO, amateur trader.
Good luck!
There were signs of a price increase last week, according to the RSI and MACD indicators.
The price closed on 07.31.2026: $129.87.
Price target: $197.95/ $249.38
Stop loss: $114.75 (-11.6%)
R/R: 4.5
IMO, amateur trader.
Good luck!

Disclaimer
The information and publications are not meant to be, and do not constitute, financial, investment, trading, or other types of advice or recommendations supplied or endorsed by TradingView. Read more in the Terms of Use.
Disclaimer
The information and publications are not meant to be, and do not constitute, financial, investment, trading, or other types of advice or recommendations supplied or endorsed by TradingView. Read more in the Terms of Use.